The Science of Wearable Accuracy: How Coaches Help You Interpret Optical Heart Rate, GPS, and Power Data Errors
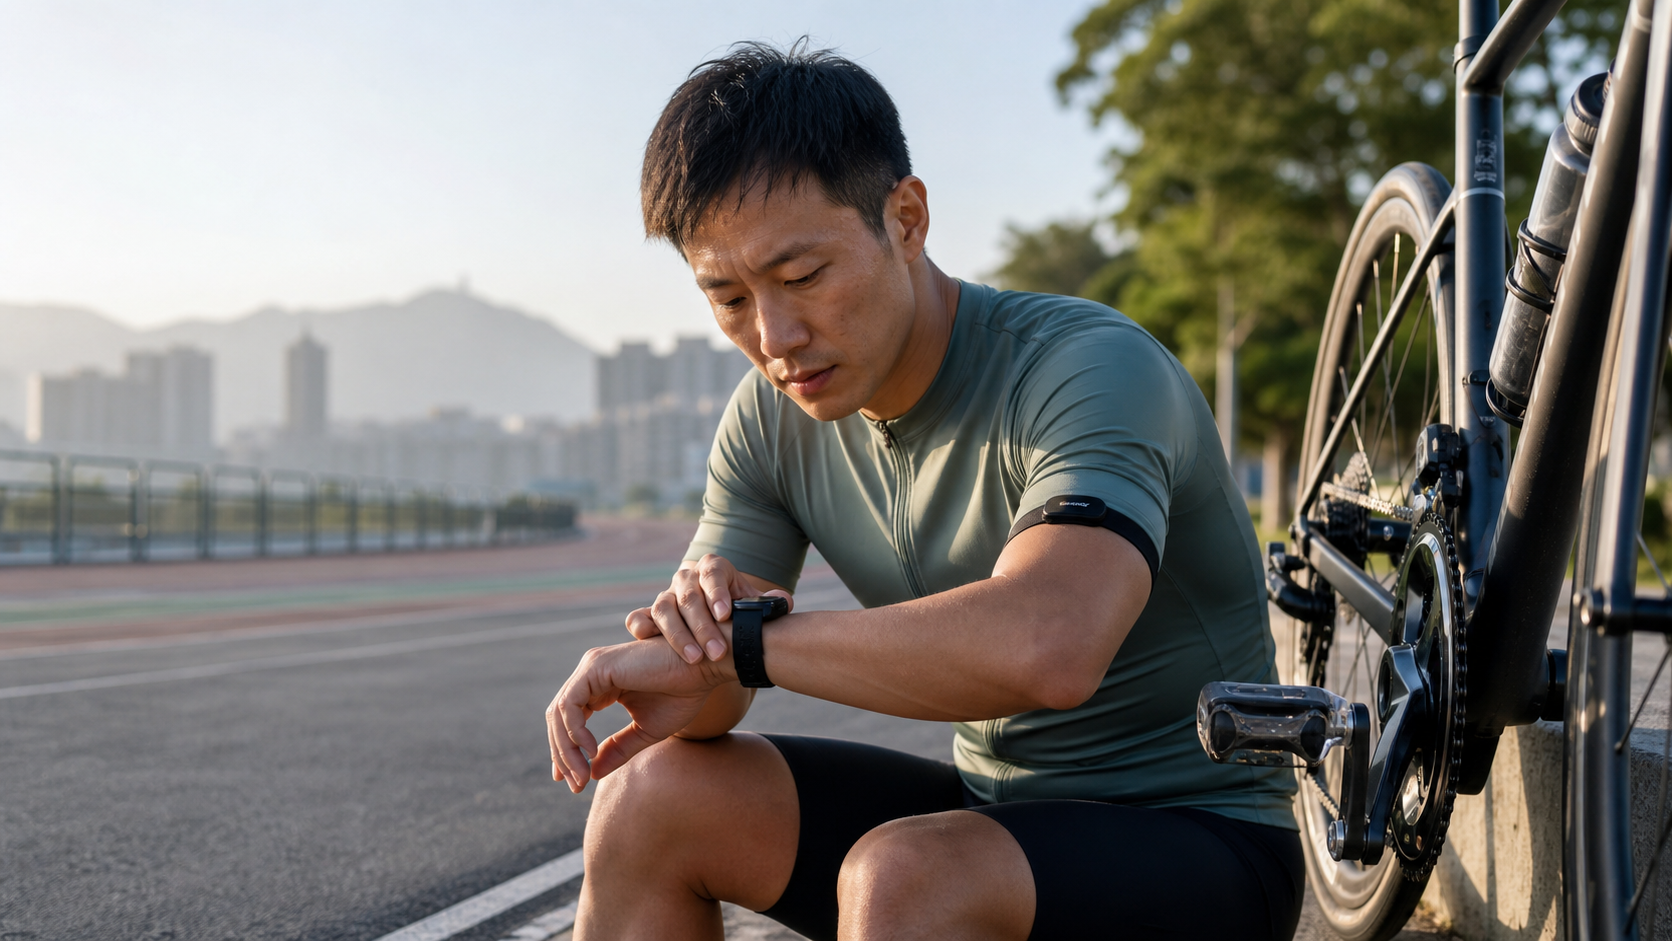
Coach’s Opening: What I Fear Most Is Athletes “Believing the Wrong Numbers”
In my fifteen years coaching athletes, the toughest problems I’ve faced often aren’t about athletes not training hard enough—it’s about athletes trusting the number on their watch too much.
One of my athletes, A-Kai, who works at a Hsinchu Science Park company, was preparing for Challenge Taiwan 226 last year. During the run leg, his heart rate would always spike to 178 bpm. He was terrified, thinking something was wrong with his heart, and didn’t dare increase his training load. I had him wear both his watch’s optical heart rate sensor and a chest strap simultaneously during a track interval session. The truth came out: the optical sensor had “locked onto” the wrong signal on his wrist. His actual heart rate was around 155 bpm—the 178 the watch captured was a false peak generated by the algorithm filling in noise. He’d been needlessly stressed for three months.
Another female athlete, Xiao-Ting, had the opposite problem. She was doing a power-focused ride on Yangmingshan when her power suddenly “dropped” 20 watts on the Balaka Road section. She thought her form had collapsed, and her messages back to me were full of self-doubt. When I looked at the data, it turned out the temperature had climbed from 18°C at dawn to 30°C by noon that day. The strain gauge on her power meter had drifted with temperature and wasn’t zeroed properly, so the numbers were naturally distorted—she was fine; the instrument was lying.
These two cases taught me one thing: every number your wearable gives you carries error. Understanding how large that error is and where it comes from is what lets you decide when to trust it and when to take it with a grain of salt. In this article, I’ll use a coach’s perspective to lay out the accuracy science behind the three big data streams—optical heart rate, GPS, and power—all in one go.
1. Optical Heart Rate: Convenient, but It “Guesses” More Than You Think
The Principle: Reading Blood Flow with Light, Not Measuring Electrical Current
The green lights on the back of your watch use Photoplethysmography (PPG). The principle is this: an LED shines light into the skin, and hemoglobin in the blood absorbs specific wavelengths. Each time the heart contracts and blood flow increases, more light is absorbed and less reflects back to the sensor. The sensor captures this “periodic fluctuation in reflected light intensity,” and an algorithm then estimates your heart rate.
Note that key word: estimate.
This is fundamentally different from a chest strap (ECG-based sensing). A chest strap measures the actual electrical signal of the heart’s contraction—that’s the “cause” of a heartbeat. Optical heart rate measures the optical change caused by blood flow—that’s the “effect”—with an algorithmic estimate layered in between. So whenever the “light signal” is disrupted, the estimate goes off.
How Big Is the Optical Heart Rate Error, Really?
According to a study on wrist-based heart rate measurement during exercise, accuracy varies noticeably across activities. Looking at Mean Absolute Percentage Error (MAPE):
| Activity Type | Mean Absolute Percentage Error (MAPE) | Coach’s Interpretation |
|---|---|---|
| Walking | ~3.8% | Most accurate—arm is stable with a regular swing |
| Cycling | ~6.9% | Moderate—wrist is relatively fixed on the handlebars |
| Running | ~8.5% | Larger error—arm swing and muscle contraction interfere |
| Rowing-type movements | ~13.4% | Least accurate—wrist angle changes dramatically |
Another review combining multiple smartwatch models found that most devices’ heart rate percentage error falls between 1% and 9%, but poorly performing models can have a mean absolute percentage error as high as 20%. In other words, when the display shows “160 bpm while running,” the actual value could be 150 or 170—a range that’s quite damaging for training that requires precise heart rate zone control.
The research also found a conclusion that’s very practical for us: the higher up the arm you wear the sensor, the smaller the error. Across comparisons at various intensities, the upper arm position had the lowest error and the highest agreement with chest straps, followed by the forearm, while the wrist was actually the position with the largest error. That’s why many brands have launched “upper arm optical heart rate armbands” in recent years—they move the PPG sensor to the upper arm, where muscle is fuller, blood flow is stable, and swing amplitude is small, giving noticeably better accuracy than a watch.
Six Interference Factors for Optical Heart Rate
In practice, I ask athletes to remember these causes of optical heart rate inaccuracy:
- Strap too loose: The sensor doesn’t sit flush against the skin, ambient light leaks in, and the signal gets scrambled. This is the most common issue I see.
- Vigorous movement: During running, jump rope, or weight training, the wrist moves a lot, and motion noise drowns out the blood flow signal.
- Skin tone and tattoos: Green light is absorbed differently in darker skin or tattooed areas, weakening the signal. Studies have indeed documented differences in measurement validity across skin tones.
- Cold-induced vasoconstriction: Starting out on Wuling or Fengguizui on a cold winter morning, your wrist is cold and peripheral blood vessels constrict, making the blood flow signal weak—often “unreadable” for the first ten minutes.
- Wrist bone position: Wearing it over the bony protrusion of the wrist means poor sensor contact. The correct position is about two finger-widths behind the wrist, over the muscle.
- Rapid heart rate changes: During high-intensity intervals, when heart rate jumps from 130 to 170 in seconds, the algorithm “can’t keep up,” producing delayed or smoothed false data.
Coach’s Note: The classic optical heart rate failure mode is called “cadence lock”—it mistakes your stride or pedal cadence for your heart rate. If your running cadence is 180 spm (180 steps per minute) and your watch happens to show a heart rate of 178–182 bpm that’s abnormally stable and unmoving, it’s almost certainly cadence lock. A-Kai’s 178 bpm at the start was exactly this.
2. GPS: The “Accurate Track” You Think You Have Is Always Drifting
Where Does the Error Come From?
GPS (more broadly GNSS, covering GPS, Galileo, BeiDou, GLONASS, etc.) determines your position by calculating the time difference for satellite signals to reach your watch. Here’s a startling fact: a signal travel time difference of just 1 microsecond shifts your position by about 300 meters. So any factor that makes the signal “take a detour” or “arrive late” directly becomes error on your track.
Typical error sources include:
- Multipath effect: This is the biggest enemy of urban riding and running. The satellite signal doesn’t reach your watch directly—it bounces off building glass facades, water surfaces, or even dense tree canopies before arriving, taking a longer path, so the watch thinks you’re somewhere else.
- Urban canyons: In dense high-rise areas like Xinyi District or Ximending, buildings directly block or reflect satellite signals, and your position can instantly shift 10 to 50 meters.
- Tree canopy obstruction: On trails like Dakeng or the shaded sections of Yangmingshan, dense foliage weakens the signal.
- Ionospheric delay: Solar activity affects the upper atmosphere, slowing the signal down.
How Much Error Is There in Practice?
Here’s a set of reference numbers for you:
| Environment | Typical Horizontal Position Error | Example Scenario |
|---|---|---|
| Open sky | ~4–8 meters | Taitung coast, open riverside bike paths |
| High multipath environment | ~7–13 meters | Typical urban roads with building obstruction |
| Urban canyon | ~10–50 meters | Taipei Xinyi District high-rises, underpass exits |
Consumer-grade GPS has an average horizontal positioning accuracy of roughly 7 to 13 meters in high multipath environments, and about 4 to 8 meters in good open conditions. In the worst urban canyon corridors, even newer dual-frequency units—which receive two frequency bands simultaneously to combat ionospheric error and multipath, reducing median error by about 25% compared to single-frequency units—users can still see 15 to 30 meters of drift on the worst sections.
Why Is Your Pace All Over the Place?
This is the question I get asked most often. Athletes say, “Coach, I’m clearly running at a steady pace, but my watch’s real-time pace is jumping between 5:00 and 6:30!”
The reason is that positional error gets amplified into pace error when divided by time. The watch calculates real-time pace by taking “how much distance was covered in this short time interval” and converting it. If the GPS positioning drifts randomly within a small area every second, the calculated instantaneous distance will fluctuate wildly, and the real-time pace will naturally jump around like an EKG. The shorter the sampling distance, the more exaggerated the error becomes—that’s why “real-time pace” is almost untrustworthy, but “overall average pace” is relatively reliable—errors cancel each other out over longer distances.
Local Experience: The riverside bike paths at Dadaocheng and Guandu in Taipei actually have excellent GPS reception because they’re open spaces. But once you duck into the city, go under bridges, through underpasses, or run in Daan Forest Park (dense canopy), the track starts looking like scribbles. For urban runners, I always tell them to control their pace using “lap/split times” instead of “real-time pace.”
How Modern Watches “Compensate” for GPS Errors
It’s worth noting that newer watches don’t rely solely on GPS. They combine GPS signals with data from accelerometers and gyroscopes through “sensor fusion”—when you enter a tunnel or a high-rise area and satellite signals degrade, the watch temporarily switches to estimating your position and pace using arm-swing cadence and stride length, then recalibrates once the signal recovers. This is also why some watches can calculate distance on treadmills or indoors—they rely on the acceleration data from arm swings.
But this comes with a side effect: if your running form changes (e.g., stride shortens due to fatigue, or you’re scrolling your phone while running), the arm-swing characteristics change, and the estimation becomes inaccurate. So under the double whammy of poor signal + erratic form (e.g., when hitting the wall in the latter stages of an urban marathon), pace data is the least reliable. Understanding this mechanism, you’ll know why watches sometimes “mysteriously” add or subtract distance—that’s the sensor fusion making compensatory guesses during signal blackouts.
3. Power Meters: The Most Accurate of the Three, But With Its Own Quirks
Why Power Is the “Most Honest” Data
Power meters use strain gauges to measure. A strain gauge is a micro-sensor attached to the crank arm, pedal, or hub. When these components twist and deform slightly as you pedal, the electrical resistance of the strain gauge changes accordingly. The device measures this deformation to calculate torque, then multiplies it by your cadence to derive power:
Power (watts) = Torque × Angular Velocity
Unlike heart rate and GPS, power measures the actual mechanical output you’re applying to the pedals at that moment—unaffected by weather and temperature (which affect heart rate), unaffected by terrain undulation (which affects perceived pace), and unaffected by signal obstruction (which affects GPS). How hard you push, that’s how many watts it shows. That’s why power is called the “most honest” metric in training data.
Power Meter Accuracy: Specs vs. Reality
For reputable brands, the stated accuracy of power meters is approximately ±1% to ±2%, while more budget-friendly models may have tolerances stretching to ±2% to ±3%. For an athlete with an FTP (Functional Threshold Power) of 250 watts, ±2% means ±5 watts—which is perfectly acceptable for training purposes.
But here’s a crucial concept that many athletes misunderstand:
For training, “consistency” matters far more than “absolute accuracy.” As long as the 200 watts your power meter reads today is the same 200 watts it read last month, your training trends are real. Even if it systematically over- or under-reads by 3%, as long as it’s consistently off every time, you can still execute your workouts reliably and track progress.
However, independent testing often finds that actual variability exceeds the stated specs, particularly under temperature changes and maximal explosive efforts. This brings us back to Xiao-Ting’s case at the beginning—her power “dropped 20 watts” because the temperature climbed from 18°C to 30°C, causing temperature drift in the strain gauge, and she forgot to re-zero (zero offset / calibration) after the temperature stabilized.
Common Causes of Power Meter Inaccuracy
| Cause of Inaccuracy | Symptom | Correction Method |
|---|---|---|
| No zero-offset calibration | Entire ride reads systematically high or low | Re-zero before every ride and when temperature changes significantly |
| Temperature drift | Power “mysteriously drops” from morning to noon | Let it settle at ambient temperature, then zero |
| Low battery | Erratic data, signal dropouts | Replace batteries/charge regularly |
| Insufficient installation torque | Unstable readings | Tighten to manufacturer’s torque specs |
| Left/right leg estimation error | Single-sided meter ×2 over- or under-estimates | Understand whether your left and right legs are symmetrical |
3-2. Heart Rate Variability (HRV) and Recovery Data: Even More Caution Needed in Interpretation
In recent years, watches have all been touting “recovery scores,” “sleep quality,” and “HRV (heart rate variability).” Many athletes check that number the moment they open their eyes in the morning to decide whether to train that day. I want to caution: these derived metrics have even larger errors than raw heart rate.
The reason is simple: HRV requires capturing “the interval between each pair of heartbeats (R-R interval),” with precision required down to the millisecond level. But optical heart rate sensors already have about 8% error just counting “beats per minute”—getting them to accurately measure beat-to-beat intervals at millisecond precision is even harder. That’s why watch HRV is typically only measured during nighttime rest—because only then is the wrist still, blood flow is stable, and the signal is clean enough.
The principles I give my athletes are:
- Look at trends, not single days: Your HRV being 5 milliseconds lower today than yesterday means nothing; only when it trends downward for three or four consecutive days is it worth paying attention to.
- Measure under consistent conditions: Measure at the same time each day, in the same position (lying or sitting), with the same device—only then are the numbers comparable. Switch wrists, change sleep positions, and the numbers drift.
- Use as a reference, not a judge: If the recovery score says you’re “not recovered” but you feel great and your body feels smooth after warming up, trust your body. Conversely, if the score looks great but your legs feel heavy and you’re in a low mood, don’t force a hard workout.
One female age-group athlete was so anxious about her watch giving her “insufficient recovery” warnings for three consecutive weeks that she developed insomnia—and then the anxiety itself made her HRV worse, creating a vicious cycle. I asked her to turn off the recovery score for two weeks and train purely by feel; her sleep improved as a result. That’s the counterproductive effect of over-relying on data.
3-3. A Real Training Week: How Data Cross-Validates
After all this theory, I’ll use one of A-Kai’s actual training weeks preparing for Challenge Taiwan to demonstrate how to use these three data types together and cross-validate them. This is one week of his bike/run schedule during peak phase (swim omitted):
| Day | Workout | Primary Data | Secondary/Validation Data |
|---|---|---|---|
| Tuesday | Bike threshold 4×8 min @ FTP 95–100% | Power (240–250 W) | Chest strap HR to confirm drift |
| Wednesday | Easy aerobic run 60 min | Optical HR (aerobic zone) | RPE (can hold conversation) |
| Thursday | Run 5×1000m intervals | Chest strap HR + split pace | GPS lap pace (non-instantaneous) |
| Saturday | Long ride 4 hours | Power (endurance zone 65–75% FTP) | HR drift monitoring for hydration |
| Sunday | Brick session (bike to run) | Power → chest strap HR | RPE transition response |
The key point: each workout uses the most accurate data as the primary control and the second-most accurate as validation. For threshold work, power is the throttle because power isn’t affected by heart rate lag under fatigue; but we also watch chest strap HR—if at the same 245 W, the later part of Saturday’s long ride shows HR 10 bpm higher than the earlier part, that’s normal cardiac drift, reminding him to hydrate and replace electrolytes. Interval runs work the opposite way: chest strap HR confirms intensity is truly on target, while GPS lap pace is only checked as total time per rep, not the jittery instantaneous pace.
This “primary + validation” dual-data habit is the biggest difference between advanced athletes and beginners—it’s not about having more devices, but knowing when each number should take the lead and when it should step aside.
4. Accuracy Overview of the Three Data Types (Coach’s Quick Reference)
Comparing all three side by side, you’ll see exactly how much to trust each number:
| Data | Measurement Principle | Typical Error | Most Reliable Use | Least Reliable Use |
|---|---|---|---|---|
| Optical HR | PPG optical estimation | ~8.5% MAPE running; up to 20% on poor units | Steady aerobic pace, recovery day monitoring | Instantaneous HR during high-intensity intervals, cadence-lock situations |
| GPS positioning/pace | Satellite time difference | 4–8m open sky, 10–50m urban canyons | Overall average pace, total distance, route tracking | Instantaneous pace, tree canopy/tall building sections |
| Power | Strain gauge torque | ±1–2% (spec) | Segment intensity control, tracking FTP trends | Absolute values after forgetting to zero, extreme temperature swings |
5. Adjusting Usage Based on Accuracy: A Coach’s Practical Prescriptions
Once you know the magnitude of error, the key is how to use it. Here are the operating principles I actually give my athletes.
Prescription 1: High intensity → power or chest strap; low intensity → optical HR is enough
Because optical HR is least accurate when heart rate changes rapidly:
- Intervals, hill sprints, race-pace workouts that require precise intensity control: use power on the bike; for running, a chest strap is strongly recommended.
- Recovery runs, long aerobic efforts, sleep and resting HR monitoring: optical HR is more than sufficient—convenience trumps everything.
Prescription 2: Use GPS in “segments,” not “instantaneous”
- Control pace by per-kilometer lap pace or overall average; don’t stare at instantaneous pace and get anxious.
- In urban or tree-canopy sections, switch to RPE + HR/power as support, treating GPS as a reference rather than gospel.
- When calculating race distance, understand your watch’s total distance may differ from the official course by 1–3%—this is completely normal in a marathon (your actual running line + GPS error usually makes the watch read slightly long).
Prescription 3: Two habits for power meters
- Zero before every ride, especially on cold early-morning starts or when wheeling the bike out of an air-conditioned room into large temperature swings.
- Trust trends, don’t obsess over single absolute values. If you can hold 240 W steadily on this week’s threshold workout and only 230 W last month, that improvement is real—don’t worry about how many watts your power meter reads versus someone else’s.
Actionable advice for athletes at different levels
Beginners / finishing your first triathlon:
- The optical HR built into your watch is enough; first build the habit of “using data.”
- Learn to hold one HR zone (e.g., aerobic zone around 70–80% of max HR) and run steadily; no need to chase top-tier equipment.
- Remember instantaneous pace will jump around—look at lap splits and don’t doubt yourself.
Advanced age-groupers / chasing a PB:
- Invest in a chest strap (running) and a power meter (cycling)—these two offer the highest marginal return.
- Build your own power-zone and HR-zone cross-reference, and validate them against each other.
- Learn to read “cardiac drift”—when HR rises at the same pace in the later part of a long effort, it’s a signal about endurance or hydration status.
Elite / Kona or national top-100 qualification:
- Go all-in on power, chest strap HR, and running dynamics, and periodically verify consistency against a third-party reference (e.g., riding the trainer against another power meter).
- Understand each device’s error characteristics so you know which one to trust when making race-day decisions.
- In hot races (like Taiwan summer triathlons), especially understand power meter temperature drift—warm up and zero thoroughly before the start.
6. Common Mistakes and Fixes
In all my years coaching, the same mistakes keep recurring. Here are the most common ones:
Mistake 1: Treating optical HR as the sole basis for race pace
Symptom: During a race, optical HR locks or lags; the athlete slows down or speeds up based on a false HR reading, completely disrupting their rhythm.
Fix: In high-stakes race situations, use power (bike) or chest strap (run) for key disciplines; optical HR is only a supplementary reference.
Mistake 2: Staring at instantaneous pace and letting numbers hijack your emotions
Symptom: Instantaneous pace jumps to 6:30, the athlete panics and surges—but it’s just GPS jitter. Result: pace fluctuates wildly and efficiency plummets.
Fix: Switch to lap pace, or simply change the watch display to “average lap pace”—out of sight, out of mind.
Mistake 3: Power “dropping” makes you question everything
Symptom: Temperature swings cause power drift; the athlete thinks their form has declined and overtrains or loses confidence.
Fix: Zero first, then judge. Only discuss physiological state after ruling out equipment factors.
Mistake 4: Wearing the watch strap too loose, then blaming the watch
Symptom: Loosening the strap for comfort causes optical HR to jump around the entire session.
Fix: During exercise, slide the watch higher up the wrist, keep it snug against the muscle, and tighten it enough that it doesn’t slide but isn’t cutting off circulation.
Mistake 5: Directly comparing absolute numbers across different devices
Symptom: Comparing FTP wattage with riding buddies, or arguing over whose watch distance is more accurate for the same race.
Fix: Devices from different brands and with different principles inherently have systematic differences—comparing against your own historical data is the only comparison that matters.
7. FAQ: Questions Athletes Ask Me Most
Q1: Should I buy a chest strap? Isn’t optical heart rate convenient enough?
If you do high-intensity workouts like intervals or hill sprints, or want to precisely control race heart rate, I strongly recommend getting a chest strap. For daily aerobic and recovery monitoring, optical is fine. Many athletes do this: wear the watch’s optical heart rate on a daily basis, and only add a chest strap for key workouts—best of both worlds.
Q2: Is a dual-band GPS watch worth the extra money?
If you mainly train in open environments (riverside paths, countryside, island tours), single-band is sufficient. But if you frequently train in high-rise dense areas like Taipei’s Xinyi District or Ximending, or on shaded routes in Daan Forest Park or Yangmingshan, dual-band does make a noticeable difference in reducing track drift, with median error reduced by about 25%.
Q3: My watch shows I ran 42.6 km for the marathon—did I run extra?
Most likely you didn’t run extra; it’s a combination of two factors: one is the actual route you ran (not hugging the shortest path perfectly, dodging people, detouring for aid stations), and the other is accumulated GPS error making the track slightly longer. A reading 1–3% longer than the official course distance is normal—don’t worry about it.
Q4: How often should I calibrate my power meter?
Developing the habit of zeroing before every ride is the safest approach, especially when temperature differences are large. The manufacturer’s recommended periodic calibration (factory calibration) depends on the brand, usually once a year or based on mileage.
Q5: My heart rate watch can’t get a reading for the first ten minutes on cold winter mornings. Is that normal?
Yes, it’s normal. Low temperatures cause peripheral vasoconstriction, weakening the blood flow signal. Optical heart rate only stabilizes once blood flow increases after you warm up. This is also why, if your winter workouts depend on heart rate, you should use perceived effort for the first part and look at the data only after your body is warm.
Q6: Is the elevation gain (total EG) shown on the watch also inaccurate?
This is a pain point for many riders tackling Wuling or the Hualien–Taitung loop. Watches measure elevation in two ways: GPS-based vertical positioning (with greater error—vertical error is typically more than 1.5 times horizontal error) or via barometer. The barometer is relatively accurate but is affected by weather pressure changes—when a cold front passes and pressure drops suddenly, the watch may think you’re “climbing.” So for total elevation gain, comparing the same device against your own historical records is fine, but comparing it with others is meaningless. When climbing Wuling, I always advise athletes to look at current elevation milestones (like passing Yuanfeng or Kunyang) rather than obsessing over the decimals of cumulative gain.
Q7: Can I trust the calorie expenditure (kcal) reading?
Almost all devices’ calorie estimates are rough guesses. They use formulas based on heart rate, weight, age, and sex—and heart rate itself has error, plus the formulas are based on population averages. In practice, relative comparisons on the same device (burned more today than yesterday) have some reference value, but the absolute kcal number can have 20–30% error, making it unreliable for calculating “how much extra I can eat today.” For fueling and weight management, you still need to rely on long-term perceived effort, performance, and body composition changes.
Conclusion: Devices Are Tools, Judgment Is Yours
Back to the beginning. A-Kai later switched to a chest strap, his training heart rate became crystal clear, and he successfully completed his first 226; Xiao-Ting, after understanding the need to zero her power meter, was no longer startled by temperature drift and made steady progress in her Yangmingshan power workouts.
The common thread in both stories is: they didn’t buy more expensive devices—they understood the error characteristics of the devices they already had.
Wearable technology has advanced rapidly in recent years, but the laws of physics haven’t changed—optical heart rate will always be an “estimate,” GPS will always be interfered with by buildings and tree canopies, and power meters will always have temperature quirks. What you can do isn’t to chase a “perfectly accurate” magic device (it doesn’t exist), but to understand the credible range of each number and use the right data in the right context.
Data is a reference for your judgment, not an authority that replaces it. When you can tell at a glance “this heart rate is stuck,” “this pace is GPS drift,” or “this power reading wasn’t zeroed,” you’ve transformed from an athlete led around by numbers into one who truly masters data.
I often tell athletes this: the best sensor is actually your own body. A watch can measure heart rate, pace, and power, but it can’t measure how well you slept last night, how much work stress you’re under, whether your legs are subtly aching, or whether you have the mental drive to push hard. These “subjective but real” signals often tell you your body’s state earlier than any objective data. Elite athletes aren’t the ones with the most data—they’re the ones who can blend objective data with subjective feel to make the best decisions.
So next time you look at a number on your watch, first ask yourself three questions: What’s the principle behind this number? Given its current circumstances (intensity, environment, temperature), will it be accurate or not? Does it match how I feel? Once you’ve answered these three, your command of data already surpasses most runners and cyclists who just stare at the screen.
That is what I’ve wanted to teach every athlete in the past fifteen years.
References
- Accuracy of Wrist-Worn Heart Rate Monitors: A Comprehensive Review of Smartwatches in Exercise Monitoring — https://www.researchgate.net/publication/385877914_Accuracy_of_Wrist-Worn_Heart_Rate_Monitors_A_Comprehensive_Review_of_Smartwatches_in_Exercise_Monitoring
- Impact of Anatomical Placement on the Accuracy of Wearable Heart Rate Monitors During Rest and Various Exercise Intensities(MDPI Sensors)— https://www.mdpi.com/1424-8220/26/1/176
- Validity of heart rate measurements in wrist-based monitors across skin tones during exercise(PLOS One)— https://journals.plos.org/plosone/article?id=10.1371%2Fjournal.pone.0318724
- Smartphone GPS accuracy study in an urban environment(PLOS One)— https://journals.plos.org/plosone/article?id=10.1371%2Fjournal.pone.0219890
- GPS Overview Part 2: What Creates GNSS Positioning Error?(Eos Positioning Systems)— https://eos-gnss.com/knowledge-base/gps-overview-2-what-creates-gnss-positioning-error
- What is GNSS multipath mitigation?(u-blox)— https://www.u-blox.com/en/technologies/multipath-mitigation
- Caveats and Recommendations to Assess the Validity and Reliability of Cycling Power Meters: A Systematic Scoping Review(PMC)— https://pmc.ncbi.nlm.nih.gov/articles/PMC8749704/
This article is educational content and does not replace individual assessment by a physician, physical therapist, or nutritionist.
Related Reading
- The Science of Wearable Devices: How Accurate Is the Data on Your Wrist?
- The Truth About Wearable Accuracy: How Much Can You Trust Heart Rate, Sleep, and Recovery Scores
- GPS Watch Optical Heart Rate vs. Heart Rate Strap: Which Is More Accurate? A Practical Guide for Taiwanese Runners
- Validity of Wearable Devices in Training Monitoring: A Comparative Study of Commercial Products vs. Laboratory Equipment
西進武嶺 免費訓練分析服務 Intervals | 練不夠還是練過頭?你哪一種類型選手?AI模型告訴你! | 備戰神器 | 公路車 訓練 | CT Yeh
4 年前
#公路車 #Vo2Max #最大攝氧量 測驗 體驗 | 心肺測試
6 年前
2026 車錶排行榜!誰是最多車友正在使用?練家子最愛哪款?🏆 (2萬名車友數據) / 公路車 / CT Yeh
5 個月前
全台首發神車錶! iGPSPORT iGS630 兩趟一日北高的續航! 超強導航、功率訓練、超人性APP! Garmin & Bryton 有對手了嗎? | 公路車 |CT Yeh
3 年前
2022 前十五大自行車錶 !? 兩萬名車友大數據統計 | 你的上榜了嗎? | 菁英車友都用哪些錶? | Bryton Garmin 誰能拔得頭籌?| 車錶推薦 | 公路車 CT Yeh
4 年前
西進武嶺 自製新版AI配速表產生器 x 賽前攻略 抱佛腳! 沒有功率計也可以產生配速表嗎?有什麼其他眉角賽前要注意的呢? | 西進武嶺 / 東進武嶺 KOM 攻略 | 公路車 | CT Yeh
4 年前
2025 自行車錶排行榜 兩萬車友大數據 / Garmin Bryton 排名會大洗牌嗎? / 全新的碼表前身分析 /公路車 / CT Yeh
1 年前
西進武嶺 8000名單車友數據分析 PART1 | 從新手到高手數量/瓦數/推力比/FTP推力比/功率計使用率 大解析 | 公路車 | CTYeh
5 年前