The Mathematical Modeling of Athletic Performance: From Banister to the Modern Era—Why Formulas Won't Save You, but They're Worth Understanding
Opening: The Sub-3 Marathoner Staring at TSS Numbers, Unable to Sleep
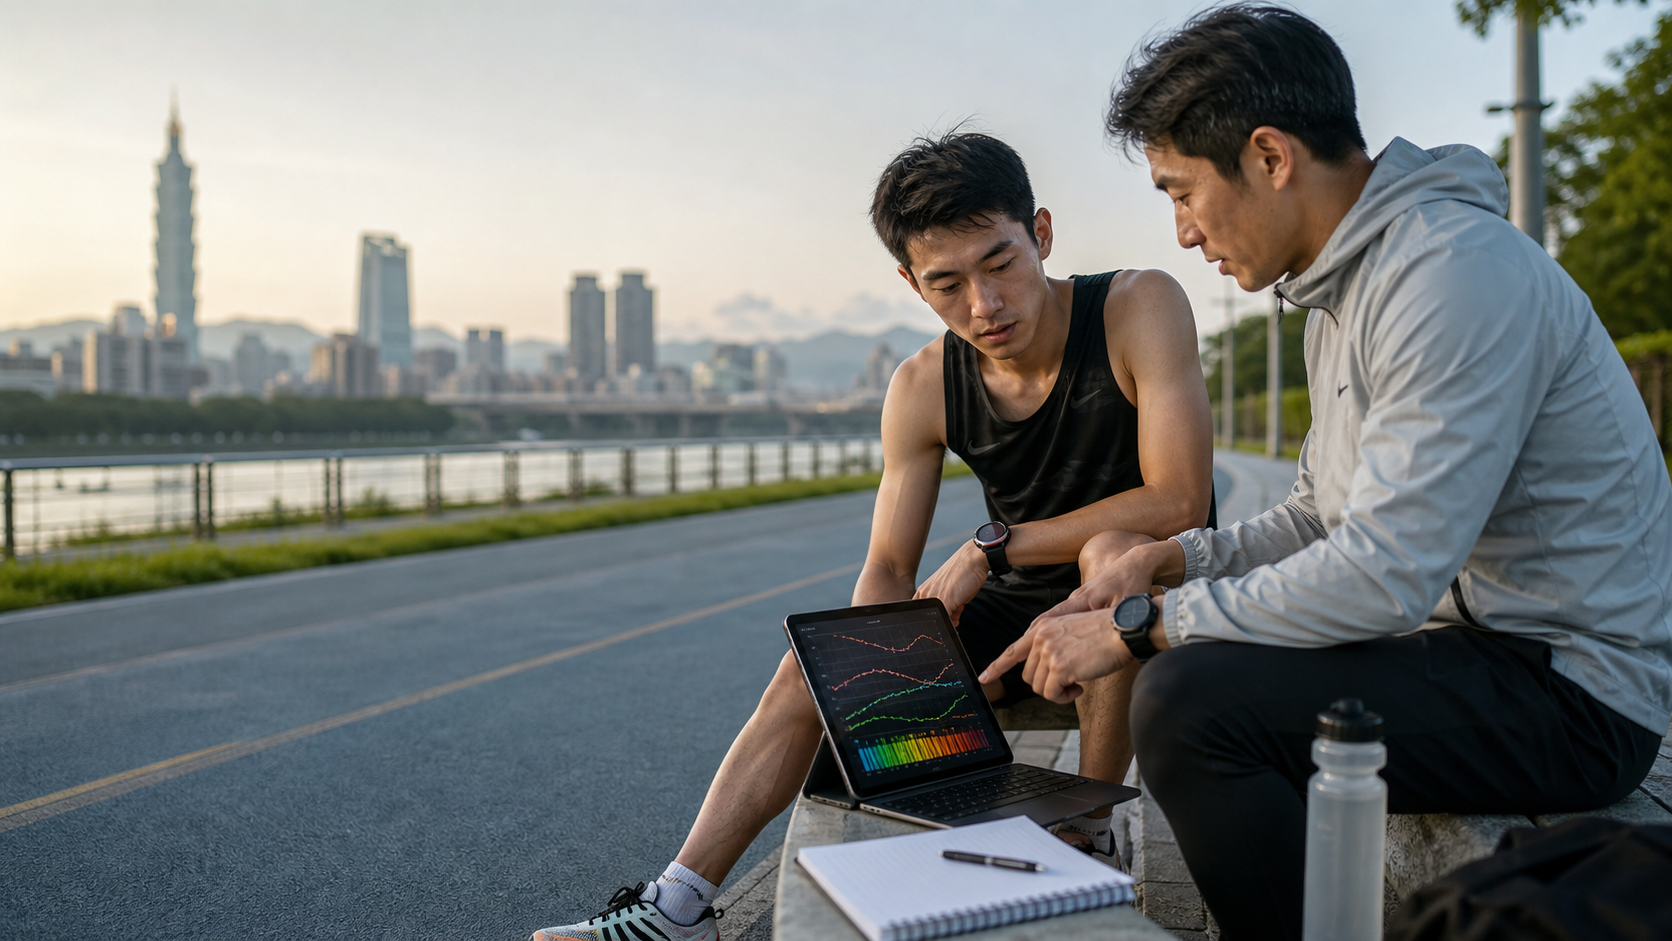
I once coached an engineer, let’s call him A-Zhe. He was a data engineer at a tech company in Taipei; numbers were his native language. When he came to me, he had already run a 3:15 marathon and his goal was to break 3 hours. At our first meeting, he opened his laptop, showing me a chart he’d plotted himself in Python: a blue line for “fitness,” a red line for “fatigue,” and a green line—the difference between the two—which was his predicted “performance.” He said proudly, “Coach, I coded the Banister model myself. The green line peaks this week, so I’ve scheduled a half-marathon time trial.”
That half-marathon, he blew up. His pace fell apart, and he walked the last three kilometers home.
He was baffled: “Math doesn’t lie. Why did the model say I was in peak form, yet I ran my worst?”
This article is meant to answer A-Zhe’s question. The mathematical modeling of athletic performance, from 1975 all the way to today’s machine learning, is a fascinating history full of pitfalls. I want to help you understand: what these formulas are saying, why they’re useful, and—more importantly—why they fail, and how you, as an actual athlete training in Taiwan, can use them wisely instead of being held hostage by them.
Let me give you the conclusion first, so you don’t think I’m just pouring cold water on you: A mathematical model isn’t a crystal ball; it’s a pair of glasses. With them on, you’ll see more clearly, but you still have to walk yourself, and you’ll still step on rocks.
1. The Scientific Foundation: What Exactly is Banister Calculating?
1.1 A Counterintuitive Core Concept
In 1975, a scholar named Eric Banister proposed an idea that still influences every sports app today: the impulse-response model.
His core insight actually aligns perfectly with our bodily experience, yet it’s often overlooked by amateurs: Every training session produces two effects simultaneously—a positive “fitness” and a negative “fatigue.” Your current ability to perform equals fitness minus fatigue.
Put it in a formula everyone can remember:
Performance = Fitness − Fatigue
That sounds obvious, but Banister added a crucial second layer of insight, and this is the real essence:
After a training session, fatigue initially exceeds fitness, so your performance capacity drops first; but fatigue dissipates faster than fitness, so as time passes, fitness gradually “surfaces,” and performance capacity rises.
This is precisely the mathematical language behind “supercompensation” and “tapering.” The day after a heavy training block, your legs feel heavy and you can’t run—not because you’ve gotten weaker, but because the negative curve of fatigue has temporarily overshadowed the positive curve of fitness. Once fatigue recedes enough, the moment you “surface” is your peak form.
I often use this analogy with my athletes: Fitness is like savings; fatigue is like credit card debt. Every time you swipe the card (train), you simultaneously increase both savings and debt, but the debt’s interest is paid off quickly while the savings last long. A taper week is the process of “stop swiping, let the debt clear, and reveal the savings.”
1.2 Turning “Training” into a Number: TRIMP
For the model to work, you first need to quantify “how much you trained today” into a single number. The tool Banister used is called TRIMP (Training Impulse).
The basic concept of the calculation is:
TRIMP ≈ Training duration × Intensity weighting based on heart rate
The heart rate here isn’t the raw bpm multiplied directly; it uses the concept of Heart Rate Reserve—that is, the relative position of your current heart rate within the range between your maximum heart rate and resting heart rate—then multiplied by a weighting factor that increases with intensity (because the physiological stress of high intensity amplifies non-linearly, not linearly).
Here’s an example that’s easy for a Taiwanese runner to understand. Let’s say A-Zhe:
- Resting heart rate 48 bpm, max heart rate 190 bpm, heart rate reserve = 142 bpm
- One day, he does a 60-minute easy run along the riverside, average heart rate 140 bpm
His relative intensity is approximately (140−48)/142 ≈ 0.65, which is low-to-moderate intensity. The system would assign a moderate weighting to this, producing a moderate TRIMP value. If he instead did 60 minutes of intervals at the track with an average heart rate of 175 bpm, his relative intensity would jump to 0.89, the weighting factor would be greatly amplified, and the TRIMP value could be more than double that of the easy run.
The point isn’t to memorize the formula, but to understand what it’s trying to capture: training that is both long and hard produces the greatest impulse; training that is short and light produces the least. This matches your body’s intuition.
A note: You might see TSS (Training Stress Score) or Suffer Score on Garmin, Strava, or TrainingPeaks. They’re close relatives of TRIMP, using power or heart rate to estimate the same thing—how much internal load today’s session placed on your body. Different names, same soul.
1.3 Two Time Constants: The Soul of the Model
After feeding daily TRIMP values into the model, fitness and fatigue each accumulate and decay along an “exponential decay” curve. Each curve has a time constant that determines how quickly it fades:
| Component | Meaning | Typical Time Constant (Conceptual Range Only) | Plain English |
|---|---|---|---|
| Fitness | Long-term positive adaptation from training | Longer (on the order of weeks) | Savings, lasts long |
| Fatigue | Short-term negative cost from training | Shorter (on the order of days) | Credit card debt, fades fast |
I want to emphasize: The time constants in the table above are only “conceptual magnitudes,” not numbers for you to plug in directly. These parameters differ for everyone, and even for the same person at different training phases. This is the first hint of the “model inaccuracy” we’ll discuss later.
1.4 Fifty Years of Evolution: A Timeline of Modeling History
Many people think athletic modeling is a recent development, but this path has been walked for half a century. I’ve drawn a simplified timeline for my athletes to help everyone understand “whose shoulders the apps we use today are standing on”:
| Era (Approximate) | Milestone | Conceptual Shift |
|---|---|---|
| 1970s | Banister proposes the impulse-response model and TRIMP | First time “training → performance” was written as a calculable formula |
| 1980s-1990s | Model applied to case studies in swimming, running, cycling | Moving from theory to tracking actual athletes |
| 2000s | TSS, power meters become widespread, commercial platforms emerge | Packaging academic models into dashboards accessible to everyone |
| 2010s | Academia systematically examines the model’s statistical flaws | Beginning to honestly confront the issue of “inaccurate predictions” |
| 2020s to present | Machine learning and multivariate methods supplement traditional models | Moving from two variables to multi-dimensional, but still requiring large amounts of clean data |
The key point this table conveys: Each generation of methods doesn’t overturn the previous one; it fills in the previous one’s blind spots. Banister’s formula is still alive in every calculation your watch makes today, just wrapped in several more layers. Understanding this context means you won’t blindly worship “the latest AI prediction,” nor will you dismiss “old-fashioned TRIMP”—they are upstream and downstream of the same river.
2. Practical Methods: How Models Are Used in Real Training
Math is math, but we’re here to train. Here’s how I actually implement this framework with my athletes.
2.1 Three Metrics You Use Daily but Might Not Know by Name
Modern training apps (TrainingPeaks’ PMC chart, intervals.icu, Garmin’s Training Status) are almost all direct descendants of the Banister model, just repackaged. They typically give you three lines:
| Metric (Common English Abbreviation) | Corresponding Banister Concept | Plain English | Practical Use |
|---|---|---|---|
| CTL (Chronic Training Load, long-term average) | Fitness | Your accumulated fitness base over roughly the past 6 weeks | Track long-term progress trends |
| ATL (Acute Training Load, short-term average) | Fatigue | Your accumulated fatigue over roughly the past week | See if you’re overtraining |
| TSB = CTL − ATL (Training Stress Balance) | Performance | How much you’re “surfacing” today | Time your peak race form |
A-Zhe’s original mistake was that he only stared at TSB (the green line). Seeing it turn positive, he assumed he was at peak form and scheduled a hard time trial. But TSB is an indirect estimate based on “averages.” It doesn’t know you only slept 5 hours last night, that work stress is through the roof, that eating out left you bloated from salt, or that Taipei just hit a humid, muggy plum rain season. The model sees your training; it doesn’t see your life.
2.2 A Practical, Actionable “Taper Week” Training Plan Example
Tapering is the most classic and best-evidenced application of the Banister model—by reducing load, fatigue recedes, fitness surfaces, and TSB peaks on race day. Here’s the two-week taper framework I designed for A-Zhe (using a marathon as an example, with intensity zones described using RPE 1-10 and heart rate to avoid false precision):
| Weeks Before Race | Weekly Mileage Relative to Normal | Key Workouts | Purpose (in Model Language) |
|---|---|---|---|
| 3 weeks out (final big week) | 100% | One long run, one tempo run | Last push to build the fitness savings |
| 2 weeks out | ~70-80% | Keep intensity, cut volume | Start bringing fatigue (ATL) down |
| 1 week out | ~50-60% | Short intervals to maintain neuromuscular sharpness | ATL drops significantly, CTL barely drops |
| 2-3 days before | ~30-40% | A few short strides, lots of rest | TSB peaks, form surfaces |
There’s a key point often misunderstood here: Tapering doesn’t mean stopping training entirely. Complete rest causes a loss of “sharpness” (neuromuscular coordination, the feel of lactate tolerance). The correct taper is “cut volume, keep intensity”—significantly reduce total mileage while retaining a small amount of high-intensity stimulus, so that the drop in fitness is far smaller than the drop in fatigue. This is exactly what the model tells us: fatigue fades fast, fitness fades slowly, so a short taper allows net TSB to rise.
2.3 Taiwan-Specific Adjustments: Variables the Model Doesn’t Tell You
Training in Taiwan, there are several local variables that seriously interfere with the model’s predictions, and I always remind my athletes about them:
- Heat and humidity: Taiwan summers routinely hit 32°C with humidity above 80%. At the same pace, heart rate can run 10-15 bpm or even higher in hot, humid conditions. This means your TRIMP will be overestimated—the model thinks you trained hard (high heart rate), but you were really just battling the environment, and the actual training stimulus wasn’t that great. Take summer CTL numbers with a grain of salt.
- Eating out and hydration: Eating out in Taiwan tends to be salty, with high sodium intake, leading to pre-race bloating and false weight gain that affects feel and pace. During taper weeks, I ask athletes to pay a bit of attention to lighter meals and hydration, but this is general advice, not a precise sodium dosage.
- Terrain: Riverside bike paths, track’s PU surfaces, and school tracks are the home turf for most Taiwanese runners. Riverside paths are flat and easy for pacing but exposed to the summer sun and winter northeast monsoon headwinds; tracks are monotonous but great for intensity sessions. All of these affect the actual physiological load of the same workout, while the model only sees heart rate and time.
2.4 The Cycling Special Case: Power Makes Modeling More Accurate, But Also Easier to Self-Deceive
Since this article is categorized under “Cycling Science,” I need to address cycling specifically. Compared to running, which can only estimate load via heart rate, cycling has a tool runners envy: the power meter. Power is the actual wattage you’re putting into the pedals—a direct measurement of external load, unlike heart rate, which is heavily influenced by temperature, caffeine, dehydration, and sleep.
This makes cycling modeling inherently more accurate. TSS calculated from power is more stable and repeatable than TRIMP calculated from heart rate. One of my athletes who completed the Wuling Challenge relied on power data to manage his training load very precisely.
But power also brings a new trap of self-deception: Because power is so objective, many cyclists over-trust it, ignoring the fact that the same wattage carries a completely different internal cost to the body depending on your state. Let me use a table to illustrate the real burden of the same 250 watts in different situations:
| Situation | Power Output | Heart Rate Response | Subjective Feel | True Internal Load |
|---|---|---|---|---|
| Cool morning, well-rested | 250 W | Moderate | Comfortable, manageable | Moderate |
| Hot, humid summer afternoon in Taiwan | 250 W | Noticeably elevated | Very hard | High |
| Sleep-deprived, early-stage cold | 250 W | Abnormally elevated | Extremely painful | Too high, dangerous |
The same power number yields an identical TSS, but the cost to your body is vastly different. This is exactly why I always require cyclists: next to your power data, you must always view heart rate and subjective feel side by side. When you notice “the same wattage, but today my heart rate is much higher and I feel much more tired,” that’s your body talking to you—regardless of what the model says, that’s the day to back off. Power makes external load accurate, but internal load will always need to be supplemented by your own body and your records.
3. The Limits of Prediction: Why A-Zhe Blew Up
This is the most important section of the entire article. If you only remember one thing, remember this.
3.1 The Model’s Statistical Fatal Flaw: Parameters Can’t Be Pinpointed
Recent sports science research has levied quite harsh criticism at the traditional fitness-fatigue model. Researchers point out that the model is statistically “ill-conditioned”—in plain terms, the “identifiability” of the fitness and fatigue parameter sets is poor: the same training and performance data can be fitted by many vastly different parameter combinations, all yielding similar results.
What does this mean? It means that when your app tells you “your fatigue time constant is X days,” that number isn’t very trustworthy—use a different data set, a different fitting method, and you might get a completely different value. The model usually fits your past performance well “in hindsight,” but for “predicting” future performance, its accuracy and reliability are questionable.
3.2 Physiology Is Over-Simplified
The second fatal flaw is: Real physiological adaptation is far more complex than “two exponential curves subtracted from each other.” Research indicates that the model’s main problems stem from an over-simplification of physiological processes and treating “factors affecting performance” as a single variable.
In reality, factors affecting whether you can perform well today include at least: muscle glycogen stores, sleep quality, psychological stress, hormonal status, immune status, hydration and electrolytes, environmental temperature and humidity, and even gastrointestinal condition. The Banister model compresses this entire forest into two trees: “fitness” and “fatigue.” Compression is convenient, but compression means distortion.
On the day A-Zhe blew up, the model’s green line was indeed at its peak—because, in the single dimension of “training load,” he had tapered appropriately. But that week he stayed up late on a work project, accumulated sleep debt, and hit muggy plum rain weather—all these “invisible dimensions” the model couldn’t see deteriorated simultaneously. The model wasn’t wrong; the model was just blind—it can only see the few numbers it’s fed.
3.3 Individual Differences: No One-Size-Fits-All Parameters
Third, research repeatedly emphasizes: The optimal choice of indicators and parameters varies from person to person. A model suited for elite athletes, a single sport, and homogeneous samples may not apply to you, a different sport, or a different training pattern. This is why many studies conclude that “future validation across different sports and populations is needed.”
3.4 Is Machine Learning the Solution? Yes, But Don’t Deify It
So, would replacing the old formula with machine learning make it unbeatable?
The research attitude is actually quite pragmatic, and I agree with it: Machine learning isn’t meant to “replace” the fitness-fatigue model, but rather to “supplement” its weaknesses. By embedding physiological knowledge into non-linear, multivariate learning algorithms, machine learning has the potential to handle complex interactions that traditional models can’t (e.g., feeding in sleep, environment, and subjective feel together), and even use ensemble learning to combine multiple individualized response models.
But I want to pour some pragmatic cold water on all the A-Zhes who love numbers: Machine learning eats data. It requires long-term, clean, multi-dimensional records to learn well; personal athletic data is often sparse, messy, and discontinuous. Feed it a pile of dirty data, and what you get isn’t prophecy—it’s beautifully packaged noise. “Garbage in, garbage out” is especially brutally true in athletic modeling.
3.5 An Honest Comparison of Three Generations of Methods
To give you a pragmatic reference point for “how much to trust modeling,” let me lay out the three generations side by side:
| Method | Data Required | Advantages | Main Limitations | Who It’s For |
|---|---|---|---|---|
| Pure subjective feel (RPE, perceived exertion) | Almost no tools | Closest to reality, zero cost, always available | Subjective, hard to compare objectively long-term | Everyone, especially beginners |
| Traditional Banister/TSS model | Heart rate or power + time | Quantifies trends, shows long-term progress | Unstable parameters, over-simplified, unreliable predictions | Goal-oriented intermediate athletes, coaches |
| Machine learning / multivariate models | Large, clean, multi-dimensional data | Can incorporate sleep, environment, and more factors | Extremely data-hungry, easily deified | Advanced athletes with rich data, research teams |
After looking at this table, you should notice something: No method is “best”—only “best for your current stage.” And regardless of generation, subjective feel has been there from start to finish—it’s the foundation of all methods, not an outdated primitive tool. The best athletes I’ve coached are often those who can read the data but have never let go of their bodily sensations. The more advanced the technology, the more you must return to that most basic question: “How does my body feel today?”
4. Common Mistakes and Corrections
In years of coaching, I’ve seen all sorts of athletes led astray by numbers. Here’s a table to help you find yourself:
| Common Mistake | Underlying Misunderstanding | My Correction Advice |
|---|---|---|
| Scheduling a hard workout/time trial as soon as TSB turns positive | Assuming the model’s “performance peak” equals “the body is truly ready” | Use TSB as a reference, but always layer in sleep, mood, environment, and morning heart rate before deciding |
| Chasing ever-increasing CTL numbers | Treating the “fitness score” as the goal itself | CTL is a result, not a goal; pushing it up too fast just piles on fatigue and increases injury risk |
| Feeling safe in summer because CTL hasn’t dropped | Ignoring that heat and humidity inflate heart rate and overestimate TRIMP | Discount summer data; rely more on pace/power rather than heart rate alone |
| Feeling anxious if you miss a day of logging | Treating the tool as the master | Models are trend tools; missing a few data points won’t affect the big picture—don’t get your priorities backwards |
| Directly copying someone else’s parameters/workouts | Ignoring individual differences | Parameters must be calibrated with your own data; workouts must be adjusted to your own life and feel |
A Real Correction: A-Zhe’s Second Taper
After the blow-up, I asked A-Zhe to do something very un-engineer-like: measure his resting heart rate every morning, record a subjective state score from 1-10, and write one sentence about how he slept. These three ultra-low-tech data points, combined with his original model curves, were to be viewed together.
Three months later, during the taper for his next marathon, the model’s green line was again at its peak. But this time, his morning heart rate was 6 bpm higher than usual, his subjective score was only 5, and he hadn’t slept well the previous two nights. Together, we decided: cancel the scheduled pre-race time trial and replace it with an easy active recovery day. On race day, he ran 2:58, breaking 3 hours.
The model was “right” that time too—the direction of peak form was correct. But what truly saved him was learning to treat the model as one of his advisors, not the sole boss.
5. Actionable Advice for Readers at Different Levels
If You’re a Beginner Just Starting Out
- Don’t touch any models yet. Numbers like CTL and TSB are distractions, not help, at your current stage. What you need to build now is the “habit of regular exercise” and “basic bodily awareness.”
- Practice with the most primitive tool: subjective feel (RPE 1-10). Was today’s session easy (3), moderate (5-6), or very hard (8+)? Mastering this is worth more than any app.
- Give yourself at least one full rest day per week. Your fatigue needs to recede—that’s a physical law, not laziness.
If You’re an Intermediate Athlete with Data, Wanting to Improve (Like A-Zhe)
- You can start looking at CTL/ATL/TSB trends, but always treat them as “references,” not “commands.”
- Build your own multi-dimensional log: morning resting heart rate, sleep hours, subjective state score. These three cost almost nothing but fill the model’s biggest blind spot.
- Remember the taper mantra: cut volume, keep intensity. Don’t stop training completely.
- Learn to discount summer data; trust pace and power more, and heart rate less.
If You’re an Advanced Athlete or a Coach Leading a Team
- Treat the model as a communication tool and trend dashboard to discuss with athletes “whether the direction this month is right,” rather than predicting precise performance on a given day.
- If you want to play with machine learning, first ensure data quality: long-term, continuous, multi-dimensional. The quality of the data determines the ceiling of the model.
- Always preserve the “coach’s eye.” An athlete’s complexion, gait, and energy in conversation are things models will never learn, and they often signal “this person is about to break down” earlier than any number.
- Help athletes establish “a protocol for when data and feel conflict.” My default: when the model says train, but the athlete’s morning heart rate is clearly elevated and they subjectively feel very tired, always downgrade the session. The cost of skipping one hard session is small; the cost of overtraining or injury from pushing through is weeks or even months. This conservative bias is almost always worth it in the long run.
- Don’t let data replace conversation. I spend one or two minutes before and after every session simply asking the athlete “how do you feel today.” The information revealed in that conversation is often worth more than the entire dashboard. What models can quantify is limited; human observation will always have irreplaceable value.
6. The Six Questions Athletes Ask Me Most (FAQ)
Over the years, athletes’ questions about athletic modeling have been highly repetitive. Here’s a compiled FAQ—maybe it addresses exactly what’s on your mind.
Q1: Should I buy a watch or platform that calculates CTL/TSB?
It depends on your stage. If you’re a beginner, save your money and focus on building consistency and body awareness. If you’re an intermediate athlete with clear race goals and stable weekly training, these tools can help you see long-term trends and avoid unconsciously overtraining—the investment is worthwhile. But remember: tools are meant to aid decisions, not create anxiety.
Q2: The app says I’m “recovered and ready for high intensity,” but I feel exhausted. Who do I listen to?
Listen to your body. This is almost an iron rule. The app’s suggestion is a probabilistic judgment based on its limited inputs; it doesn’t know you were up all night with insomnia or that work stress is overwhelming. When numbers and bodily signals conflict, bodily signals always take priority. Long-term, forcing your body to fight against itself leads to overtraining or injury.
Q3: Why is my CTL stuck even though I’m training hard?
A plateau in CTL isn’t necessarily bad. It might mean you’ve entered a “maintenance phase” where your body is consolidating existing adaptations. Blindly chasing CTL upward usually results in fatigue accumulation and injury. Progress is never a straight line; it’s stair-stepped—plateaus are for recharging before the next leap.
Q4: Can the model predict my exact marathon time?
It can give you a “reference range,” but don’t treat it as a guarantee. As discussed, the reliability of such predictions is questioned by academia, and any single error on race day—weather, fueling, psychology, pacing strategy—can throw off precisely calculated seconds. Treat it as a reference for “roughly where you might land,” not a target carved in stone.
Q5: How often should I recalibrate my model parameters?
For the average athlete, I recommend reviewing trends at the end of each training cycle (roughly every 8-12 weeks), rather than obsessing over daily fluctuations. Daily noise is high; weekly and monthly trends are what matter.
Q6: Can AI/machine learning training apps solve all problems?
No. They can handle more dimensions of data, but their ceiling is the quality of the data you feed them. With sparse, messy, discontinuous data, no algorithm, no matter how sophisticated, can learn anything reliable. And no matter how advanced the model, it can’t replace a coach’s eye or your own bodily sensations. Treat AI as a very capable assistant, not an omniscient god.
7. A Health and Safety Reminder
Mathematical models have a dangerous side effect: they can make people overconfident in their ability to push through. When the green line looks beautiful, some people ignore real warning signs from their bodies and push anyway.
Please remember: models don’t detect illness. If you experience any of the following during or after training, don’t comfort yourself with “my TSB is still fine”—stop, and seek medical attention if necessary:
- Chest tightness, chest pain, abnormal shortness of breath, dizziness, or fainting during or after exercise
- Persistently abnormal elevation of resting heart rate, feelings of arrhythmia, or palpitations
- Disproportionate extreme fatigue, or an unexplained decline in performance lasting several weeks
Accessing healthcare in Taiwan is actually quite convenient; under the National Health Insurance, the threshold for cardiology or sports medicine clinics isn’t high. For those with a history of cardiovascular disease, diabetes, hypertension, or other chronic conditions, or a family history of heart disease, it is strongly recommended to consult a physician for an individualized assessment before starting or significantly increasing training intensity—these situations require professional judgment and individualized management, which no model or article can replace. Let me be conservative in my language: I’m not making any diagnoses or prescriptions here, just reminding you to leave professional matters to professionals.
Conclusion: Treat Formulas as Glasses, Not a Crystal Ball
From Banister’s single “fitness minus fatigue” equation in 1975 to today’s machine learning embedded with physiological knowledge, the mathematical modeling of athletic performance has come fifty years. The deepest lesson this journey has taught me is: The value of a model lies not in whether it can precisely prophesy tomorrow, but in whether it can help you see the chaos of training a little more clearly.
A-Zhe later said something to me that I love: “Coach, I used to think the model would give me answers. Now I know, it just helps me ask the right questions.”
That’s what I want to leave you with. Put on these mathematical glasses, and you’ll see more clearly—but you’re still the one walking, still the one feeling your body, and still the one responsible for every step. Numbers are the servant; the body is the master. Whether the tool in your hand is a fifty-year-old formula or the latest AI algorithm, what truly determines how far you can go is never how smart the model is, but whether you’ve learned to use it well while honestly listening to your body. May you train smart and train healthy, staying a little further from injury and a little closer to your passion with every ride.
This article is educational content and does not replace individualized diagnosis or treatment advice from a physician, physical therapist, or nutritionist.
References
- Fitness-Fatigue Model applications and impulse-response model concepts: https://pmc.ncbi.nlm.nih.gov/articles/PMC8949585/
- Statistical flaws of the traditional fitness-fatigue model (poor parameter identifiability, questionable prediction reliability): https://www.nature.com/articles/s41598-025-88153-7
- Conceptual problems of the Fitness-Fatigue model and contributions of machine learning: https://pmc.ncbi.nlm.nih.gov/articles/PMC8894528/
- Research on training performance prediction based on the Fitness-Fatigue model in recreational sports: https://journals.plos.org/plosone/article?id=10.1371%2Fjournal.pone.0337824
Related Reading
- The Banister Model: Mathematical Quantification of Training Load
- Supercompensation and Training Adaptation Theory: The Physiological Logic Behind Workout Plans
- The Science of Fitness Testing: How to Assess Fitness, Choose the Right Testing Venue, and Track Methods
- Reading Your Own Training Data: Mining Gold from the Garbage
西進武嶺 免費訓練分析服務 Intervals | 練不夠還是練過頭?你哪一種類型選手?AI模型告訴你! | 備戰神器 | 公路車 訓練 | CT Yeh
4 年前
live) 超越北高 之一日北高12小時 策略
7 年前
一個測試有沒有認真練車的方法😂 #公路車
10 個月前
台中大三元 計時賽 爆笑關主ALL IN 拚了 | NEKO'S FUN | 公路車 | Taiwan Cycling Route
6 年前
2026 車錶排行榜!誰是最多車友正在使用?練家子最愛哪款?🏆 (2萬名車友數據) / 公路車 / CT Yeh
5 個月前
2019 柯P 超越北高 第一集團實錄 (11小時實錄請參考另一部影片) 一日雙城 一日北高 NeverStop Taiwan Long Distance Cycling Challenge
7 年前
全台首發神車錶! iGPSPORT iGS630 兩趟一日北高的續航! 超強導航、功率訓練、超人性APP! Garmin & Bryton 有對手了嗎? | 公路車 |CT Yeh
3 年前
[教學] Premiere 影片 手震 修正 教學 防抖 單眼 影像 GoPro 穩定 Video Stabilization
8 年前