Introduction to Sports Science Research Methods: How to Read Papers (A Coach's Guide to Seeing Through the Phrase "Research Shows")
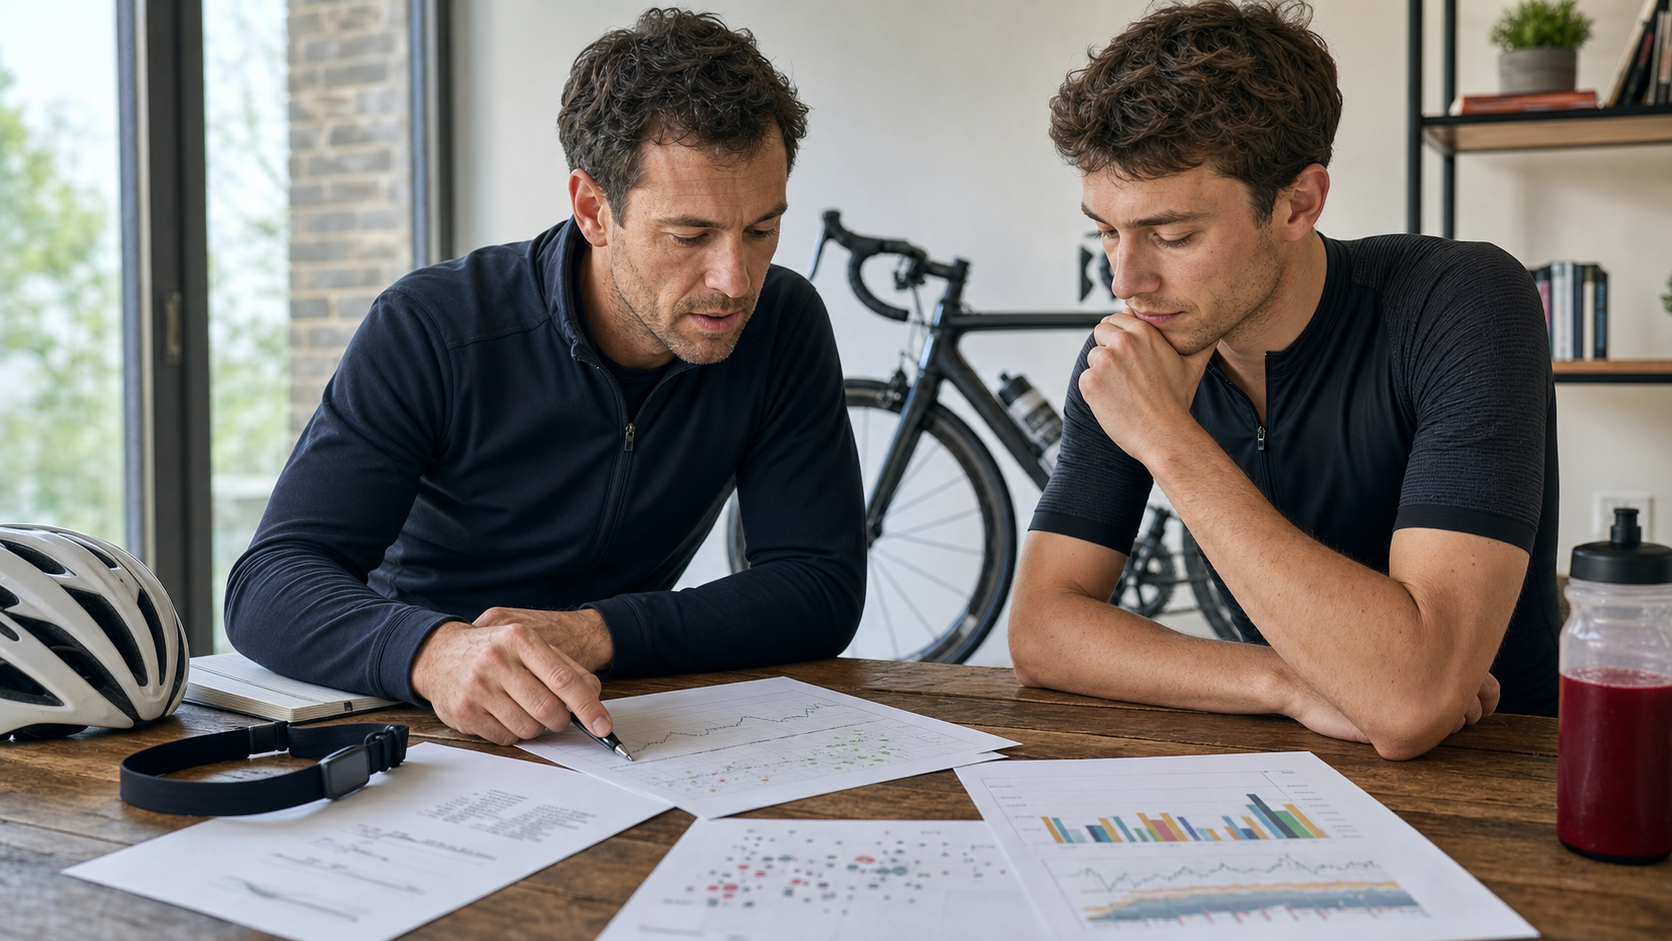
A few years ago, I was preparing an amateur road cyclist for the Wuling climb. Every week, he’d bring me a freshly translated “latest study” and ask: “Coach, this one says drinking beetroot juice can boost power by 2%—should I stock up on a case?” The next week it would be, “This one says intervals should be 30-15, not 4x4.” Looking at the screenshots on his phone, many of them were actually the same experiment, rewritten by three different fitness fan pages into three contradictory conclusions. That day, I didn’t directly answer whether he should drink beetroot juice. Instead, I spent an hour teaching him how to read a study from start to finish—because in an age of information overload, “knowing how to read a paper” matters far more than “how many papers you’ve read.”
This article is a “beginner’s guide to reading papers” that I’ve accumulated over the years from guiding my athletes—and myself—through the literature. I won’t turn you into a statistician, but I hope that after reading this, the next time you see the words “research proves,” you’ll calmly ask three questions: What level of research is this? Is its “significant” statistically significant or actually meaningful? And are there common traps hidden in between?
Why You Should Learn to Read Papers Yourself
Let’s start with a harsh reality: the media translation of sports science has a shockingly high distortion rate. A paper originally written with cautious conclusions—“In these 12 trained cyclists, a slight increase in power was observed after short-term supplementation, but larger samples are needed to confirm”—after being passed through media, fan pages, and sponsored posts, often becomes “Science proves XX makes you 2% stronger.”
Where’s the problem? Sports science has several inherent limitations that make it especially prone to overinterpretation:
- Sample sizes are generally very small: Recruiting athletes willing to undergo strict control, blood draws, and exhaustion tests is difficult; many studies have only 8 to 15 participants.
- Individual variability is huge: On the same interval program, some improve 10%, some stay flat, and some even get worse (this is called the “responder/non-responder” phenomenon). Averages wash out this variability.
- Double-blinding is difficult: It’s hard to keep subjects from knowing whether they’re doing high-intensity intervals or resting.
- Short-term markers substitute for long-term performance: The lab measures 30-second power or lactate threshold, but what you really care about is whether you’ll be faster up Wuling three months from now—there’s a huge gap in translation between the two.
So I often tell my athletes: Reading papers isn’t about finding a decree to follow blindly, but about building a “reasonable skepticism” muscle. You don’t need to reject all research, but you should know how much confidence lies behind each conclusion.
There’s also a more practical reason: your time, money, and body are precious. Every “research proves” claim may come at a cost—buying a supplement, changing a training plan, suffering through another round of hard work. If you can’t interpret studies, you’ll likely pour limited resources into things that are “statistically significant but practically meaningless,” crowding out the fundamentals you should actually be doing: sleep, consistent training, progressive overload, and dialing in your nutrition. Knowing how to read papers is, at its core, a skill for allocating your resources.
Foundational Concept One: The Hierarchy of Evidence in Study Design
This is the most important—and most overlooked—thing. Not all “research” carries the same weight. In evidence-based medicine, there’s a widely used concept called the “hierarchy of evidence” (levels of evidence), which ranks study designs from low to high based on the credibility of causal inference. More than 80 versions of this pyramid have been proposed, with varying details, but the overall framework is quite consistent.
I’ve organized the common levels into the table below, with plain-language interpretations for sports contexts:
| Evidence Level | Study Design | Plain-Language Understanding | Sports Scenario Example |
|---|---|---|---|
| Highest | Systematic Review / Meta-analysis | Collects a bunch of rigorously designed experiments and analyzes them together | “Pooling 25 studies on caffeine and endurance performance” |
| High | Randomized Controlled Trial (RCT) | Random assignment with a control group; can infer causation | “Randomly dividing cyclists into a supplement group and a placebo group” |
| Moderate | Cohort Study | Long-term follow-up of a group, but no random assignment | “Tracking 500 runners for five years to see who gets injured” |
| Moderate-Low | Case-control Study | Looks backward from outcomes to find causes | “Comparing training habits between those with and without Achilles tendon ruptures” |
| Low | Cross-sectional Study | A snapshot at a single point in time | “Surveying how many people currently use power meters” |
| Lower | Case Report / Case Series | Description of a few individual cases | “One athlete broke a PR after using a certain method” |
| Lowest | Animal/In Vitro Experiments, Expert Opinion | Mouse or cell-level research, personal views | “A mouse experiment shows ingredient X…” |
(Compiled from Wikipedia: Hierarchy of evidence and UC Davis Levels of Evidence)
How do you use this table? I teach my athletes an ultra-simple rule of thumb: When you see “research proves,” first ask, “Which level of the pyramid is this?” If a sensational conclusion comes from just one mouse study or a single case report, its weight is nowhere near that of a meta-analysis integrating 20 RCTs.
Why “Randomization” and “Control” Are So Critical
Let me explain with a scenario adapted from a real athlete. Suppose I have ten runners take a new energy gel for eight consecutive weeks, and their average 10K time improves by 90 seconds. Does that prove the gel works?
No. Because too many things happened during those eight weeks: they were already training, the weather cooled from scorching heat, they knew they were in an experiment so they tried harder (placebo effect), and they happened to avoid injuries. All of these are mixed together—I can’t tell whether those 90 seconds came from the gel or other factors.
The point of a “control group” is to have another group of similar people do exactly the same thing, except they don’t take the gel (or take an identical-looking placebo). “Random assignment” ensures the two groups start with roughly equal fitness, age, and effort levels, so I can’t cheat by secretly putting all the strong athletes in the gel group. With randomization and control, I can say with more confidence that the difference between groups is more likely caused by the gel.
This is also why I’m very cautious about claims like “this worked for my friend” or “this influencer tried it personally”—not because they’re necessarily wrong, but because they almost certainly can’t rule out all the confounding factors above.
Blinding and Placebo: Why “What You Think” Quietly Makes You Stronger
Let me add another key term many people overlook: blinding. Single-blind means subjects don’t know which group they’re in; double-blind means even the researchers measuring and administering don’t know. Why go to all this trouble? Because expectation itself affects performance.
I have a vivid example from my coaching. Once, I had two athletes of similar ability do the same threshold intervals, and I “accidentally” let one of them believe his sports drink was a “new formula, lab-verified to delay fatigue”—but both bottles were identical. The athlete who “thought he drank the miracle drink” reported significantly lower perceived exertion and even pushed through an extra set. He wasn’t lying; his brain’s expectation genuinely changed how he experienced pain—that’s the power of the placebo effect.
So when a supplement or equipment study lacks a placebo control and blinding, you need to be very cautious: a large chunk of the “improvement” it measures may come purely from the psychological boost of “subjects knowing they’re using something good.” In endurance sports, which rely heavily on subjective willpower to keep going, this effect is too large to ignore.
Conceptual Foundation 2: Statistical Significance ≠ Practical Significance
This is the section I most want you to remember from this entire article. Many people see a paper stating “p < 0.05, statistically significant” and assume “wow, this is really effective.” That is a huge misunderstanding.
First, let’s clarify what a p-value actually is. The p-value answers the question: “Assuming this effect doesn’t actually exist at all (the null hypothesis is true), what is the probability of observing a difference as large as, or larger than, what I’m seeing right now?” If this probability is very low (conventionally < 0.05), researchers say “this effect is unlikely to be zero.”
Please note—the p-value only tells you “the effect is probably not zero”; it tells you absolutely nothing about “how large the effect is.” This is the key point within the key point.
And here lies a fatal trap: as long as the sample size is large enough, any trivial difference can reach statistical significance. A classic example statisticians cite: a tutoring program raises average scores on a 100-point exam by 0.5 points. As long as you collect enough samples, that 0.5-point improvement can also achieve “p < 0.05”—but no principal would overhaul their budget for 0.5 points. (See Statistics By Jim: Practical vs. Statistical Significance)
So What Should You Look At? Effect Size
To know “how large the effect really is and whether it’s worth changing your training,” you need to look at the effect size. The most common metric is called Cohen’s d. It standardizes the difference in units of standard deviation, making it easy to compare across studies. A frequently cited rough classification is:
| Cohen’s d | Effect Size | Plain-English Translation |
|---|---|---|
| Around 0.2 | Small | There’s a difference, but it may be so small you can’t even feel it |
| Around 0.5 | Medium | Starting to be worth paying attention to |
| Around 0.8 and above | Large | Obvious, usually practically meaningful |
(Compiled based on Statistics By Jim; APA format requires reporting effect size alongside every p-value)
So next time you read a paper, develop this habit: look for the effect size first, then look at the p-value. A study with “p < 0.001 but Cohen’s d of only 0.15” is statistically very “significant,” yet practically it may be too small to justify extra money or suffering. Conversely, a small-sample study with “d = 0.7 but p = 0.08, not significant” might simply have too few participants to detect the effect—the effect itself could be substantial and worth validating with a larger sample later.
I often give my athletes this example: suppose a study claims a certain training method improves average functional threshold power (FTP). If it translates to going from 250 watts to 252 watts—no matter how pretty the p-value is, those 2 watts will make virtually no practical difference for you climbing Wuling. You’d be better off putting your energy into getting one more hour of sleep or dialing in your nutrition.
A Case Study That Ties the Concepts Together
Let me use a comprehensive case to connect “evidence hierarchy” and “effect size.” Last year, a female athlete in her thirties preparing for her first sprint triathlon brought me a news headline, roughly saying “Science proves: training this way greatly improves running economy and performance skyrockets.” Together, we found the original paper and ran through a round of questions:
- Evidence hierarchy: This was a single small intervention study, not a meta-analysis—sitting in the upper-middle of the pyramid. Worth referencing, but far from “conclusive.”
- Subjects: 15 well-trained male long-distance runners—very different from my beginner female athlete. External validity immediately raised a question mark.
- Effect size and absolute values: After converting the numbers, the improvement in running economy was modest, and the confidence interval was quite wide, indicating high uncertainty.
- Limitations: The authors themselves wrote in the discussion section: “small sample, short-term only, needs larger-scale verification.”
After going through this round, our conclusion wasn’t “this paper is garbage,” but rather “this is an interesting direction, but not enough to make a beginner female athlete overhaul her training plan immediately.” We noted it as a clue for future observation and focused on building her aerobic base and stabilizing her running form first. You see—with the same paper, whether you know how to read it leads to completely different actions.
Practical Method: A Step-by-Step Paper-Reading Workflow
Now that the concepts are covered, here’s something you can use immediately. This is the order I use when reading a sports science paper, and you can follow it. The key point is—don’t read from the first word to the last word. That’s slow and leaves you easily led astray by pretty wording.
| Step | Which Section to Read | Questions to Ask Yourself |
|---|---|---|
| 1 | Title and Abstract | What does it claim? Is it association (correlation) or causation? |
| 2 | Methods: Subjects | How many people? What level? Are they similar to me? |
| 3 | Methods: Design | Is there a control group? Randomization? Blinding? |
| 4 | Results: Effect Size | How large is the effect? Don’t just look at the p-value; look at the numbers themselves |
| 5 | Results: Variability | How wide are the standard deviation and confidence interval? Is individual variation large? |
| 6 | Discussion and Limitations | What weaknesses do the authors admit? Does the conclusion overreach? |
| 7 | Conflicts of Interest | Who funded it? Is it sponsored by a supplement manufacturer? |
Step Details and My Practical Reminders
Whether the subjects resemble you determines whether this paper even concerns you. Conclusions drawn from “well-trained young male cyclists” may be completely inapplicable to a 55-year-old female athlete just starting to ride for weight loss. Sports science has a serious “subject bias”—a large proportion of studies use young, healthy, male athletes. This is the problem of external validity (generalizability). When working with middle-aged, older, or female athletes, I always ask myself before reading any study: how far are these subjects from my athletes?
Looking at the confidence interval is more honest than looking at a single number. If a study says “average improvement of 3%,” but the 95% confidence interval is “-1% to 7%,” that means the true effect could range from “actually a slight decline” to “a decent improvement”—the conclusion is actually quite uncertain. The narrower the interval, the more reliable the estimate.
Always read the “Limitations” section. Good researchers honestly list their weaknesses: small sample, short follow-up, inability to blind, surrogate markers, and so on. If a paper’s discussion reads like an advertisement, only mentioning benefits and no limitations, my suspicion goes straight to maximum.
Check funding sources and conflicts of interest. This isn’t conspiracy theorizing. A study fully funded by a supplement brand, with authors serving as consultants to that brand, doesn’t mean the conclusions are necessarily fabricated—but you should keep a mental yardstick when interpreting it. This is especially important in research on supplements, sports drinks, and wearable devices.
A “Red Flag” Rapid Screening Table
To help you get started faster, I’ve organized the signals that should raise your alert into the rapid screening table below. You don’t need to run the full process for every article; just scan for red flags first. The more you hit, the more cautiously you should view it.
| Red Flag | Why Be Alert | Recommended Action |
|---|---|---|
| Only an abstract or press release, no original paper | Can’t check methods and data | Find the original study before judging |
| Sample size in single digits, no control group | Almost impossible to rule out confounders | Treat as a “preliminary clue,” not a conclusion |
| Reports only relative percentages, no absolute values | Easiest way to exaggerate | Convert back to absolute differences yourself |
| Only p-values, no effect size | Can’t tell how large the actual effect is | Look for Cohen’s d or raw numbers |
| Uses lab markers to claim race performance will improve | Surrogate markers don’t equal performance | Lower expectations; wait for real performance studies |
| Study fully funded by the company selling the product | Potential conflict of interest | Keep a mental yardstick; look for independent studies for comparison |
| Headline and tone read like an ad, with no limitations mentioned | Usually oversimplified | Go straight to the “Limitations” section for a reality check |
I suggest you save this table. Next time you scroll past a sensational sports science post, compare it against this—many gimmicks will be exposed on the spot.
Common Pitfalls and Corrections
In years of reading literature with trainees, I’ve found that people tend to fall into the same few traps. I’ve listed them below, along with “corrected ways to ask.”
Pitfall One: Treating “Correlation” as “Causation”
Wrong example: “Research found that runners who sleep more get injured less, so sleeping more can prevent injuries!”
The problem: This might just be correlation. Perhaps people who are “already disciplined and have well-planned training” both sleep more and happen to get injured less—sleep is just a byproduct of that “discipline,” not necessarily the direct cause. Cross-sectional and cohort studies can show that things “appear together,” but they can’t easily prove “which causes which.”
Corrected question: Is this an observed association, or a causal relationship proven by randomized intervention? Only intervention studies like RCTs give you solid ground to talk about causation.
Pitfall Two: Looking Only at Relative Values, Ignoring Absolute Values
Wrong example: “A certain supplement reduces injury risk by ‘50%’!”
The problem: If the original injury rate drops from 2% to 1%, then “a relative reduction of 50%” sounds impressive, but the absolute difference is only 1 percentage point. To benefit one person, a large group of people might all need to use it. Relative risk is the most deceptive—you must convert it back to absolute numbers.
Corrected question: What’s the absolute difference? How much do I need to invest (money, time, side effects) to gain this benefit?
Pitfall Three: Small Samples + Data Picking (p-hacking)
The problem: If a study measures a ton of variables—power, heart rate, lactate, perceived fatigue, sleep, mood—and then only picks the one or two that “happen to reach significance” for the headline, that’s a multiple comparisons problem. The more things you measure, the higher the chance of stumbling onto a “significant” result by pure luck.
Corrected question: How many variables did they measure in total? Was there a pre-registration of the study plan? Is the conclusion based only on one variable picked out of many?
Pitfall Four: Using Short-Term Surrogate Markers to Infer Long-Term Performance
The problem: Measuring “increased lactate threshold power” in the lab doesn’t equal “you’ll race faster six months from now.” Between the two lie a host of variables: training transfer, race strategy, psychology, fueling execution, and more.
Corrected question: Does the study measure lab markers or real performance (race results, finish times)? Did the authors build the bridge between the two for me?
Pitfall Five: Ignoring Non-Responders, Looking Only at Averages
The problem: As mentioned earlier, with the same training plan, some people improve a lot, others don’t respond. Reporting only the average makes you think “everyone will improve this much,” but you might just be the non-responder.
Corrected question: Did the authors report individual differences or the proportion of responders? I need to be mentally prepared: an average effect doesn’t guarantee an effect for me personally.
Pitfall Six: Treating “Not Significant” as “Proof of No Effect”
The problem: This is the reverse misreading. If a small-sample study “finds no significant difference,” many people immediately say “so this method doesn’t work.” But “no evidence of effect” is not the same as “proof of no effect.” With too few participants or too crude measurements, a real effect can easily be drowned in noise (insufficient statistical power).
Corrected question: Is it “proven ineffective,” or “couldn’t be detected this time”? Was the sample large enough? What’s the direction and size of the effect?
Pitfall Seven: Survivorship Bias and Cherry-Picked Cases
The problem: Fitness content loves to tell success stories of “breaking PRs with this method,” but never tells you how many people used the same method without results, or even dropped out due to injury. What you see is the group that “survived and spoke up”—that’s survivorship bias.
Corrected question: Where are the people who used it without results? Is this a systematic follow-up of everyone, or just selected success stories?
Actionable Advice for Readers at Different Levels
Reading research papers requires different depths depending on where you are. I’ve divided the advice into three levels—find where you fit.
Beginners: Build a “Reflex of Skepticism” First
You don’t need to understand statistics. You just need to develop three reflexive habits:
- When you see “research confirms,” first ask what level of evidence it is (top or bottom of the pyramid).
- When you see an exaggerated percentage, first ask what the absolute value is and how many people were in the sample.
- When you see miraculous supplement claims, first check who funded it.
These three moves alone will filter out eighty percent of the hype out there. At this stage, I suggest you prioritize meta-analyses and official position statements from organizations like sports nutrition societies, rather than screenshots of a single new study.
Intermediate: Learn to Read Methods and Effect Sizes
If you already know how to ride with power and read training plans, and want to go further:
- Practice reading only the abstract and methods sections to judge whether there’s a control group and randomization.
- Build the habit of “find the effect size first, then look at the p-value.”
- Read the “Limitations” section of papers to train yourself to spot weaknesses.
- For English papers, make good use of free PubMed abstracts and Google Scholar.
Advanced / Coaches: Put the Literature into the Bigger Picture
If you’re coaching others, the responsibility is heavier, because your interpretation affects other people’s bodies:
- Don’t overhaul all your athletes’ training plans because of one new study; wait for it to be replicated and validated.
- Put “population fit” first: how similar are the study subjects to my athletes?
- Remember individual differences, leave room for adjustment, and track each athlete’s actual response with real data.
- Be conservative with language when it comes to health and injury matters, and refer out when appropriate.
Additionally, the biggest thing senior coaches should guard against is “confirmation bias”—once you have a training philosophy you believe in, it’s easy to only pick studies that support you and ignore those that contradict you. My own way of dealing with this is: deliberately read high-quality research that opposes my methods. If I’m still convinced to adjust after reading, then I adjust; if my position holds up, my confidence becomes more solid. Honestly facing the evidence is the dividing line between a good coach and a stubborn one.
A Practical Local Reminder from Taiwan
When we read sports and health research in Taiwan, we need an additional layer of local calibration. Here are a few examples:
- Climate: Much endurance research is conducted in temperate, dry-cool environments. Taiwan’s summers are hot and humid, so the same hydration and electrolyte strategies may not translate directly. In practice, more aggressive cooling and hydration are usually needed.
- Diet: International nutrition research is often set against a Western dietary background. The meal structure of Taiwan’s eat-out population (bento boxes, noodles, hand-shaken drinks) is different, so carbohydrate and sodium intake patterns need to be recalculated on your own—you can’t directly apply the gram amounts in the studies.
- Healthcare access: This is actually Taiwan’s advantage. We have relatively accessible National Health Insurance, plus sports medicine and rehabilitation resources. If you experience recurring pain, suspected overtraining, or any internal-medicine warning signs, don’t self-diagnose with a paper—making an appointment with a physician or physical therapist for evaluation is more reliable than reading ten studies.
I often tell my athletes: Papers are meant to improve the quality of the questions you ask, not to replace professional assessment. Especially when it comes to physical discomfort, this line must be drawn very clearly.
- Venue and equipment: Many training studies are conducted on standard treadmills, wind-resistance trainers, or in climate-controlled laboratories. The real training scenes for people in Taiwan are often headwinds on riverside bike paths, city streets with traffic lights, slippery mountain roads, and stuffy, hot tracks. The “clean” conditions in studies need to be discounted when transferred to real-world settings—the numbers can’t be copied verbatim.
- Intensity and heat: the invisible tax of summer: Taiwan’s heat and humidity are an “invisible tax” that steals performance. The same interval intensity prescribed in a cool environment, when attempted on summer afternoons from June to September, often produces a heart rate noticeably higher than usual at the same pace, with a much heavier perceived effort. Forcing yourself to hit the study’s “target power” under these conditions easily leads to excessive fatigue. I remind my athletes: when setting intensity from studies in summer, treat “heat” as an extra variable—back off when you should, and hydrate earlier when you should.
Three Questions You Can Take With You (Pocket Edition)
If you only remember one thing, remember this table. This is the three-question sequence I require every athlete to run through mentally whenever they see any “research says”:
| Question to ask | What it verifies | What failing means |
|---|---|---|
| What level of evidence is this? | Credibility of the study design | It’s just a case report or animal study—don’t treat it as conclusive |
| How large is the effect size, and what’s the absolute value? | Whether it’s worth it in practice | Statistically significant but possibly too small to feel |
| Are there hidden traps? | Correlation/causation, funding, cherry-picked data | The conclusion may be overstated or misleading |
I often tell my athletes that once you master this three-question sequence, you’re already ahead of most people who just share headlines.
FAQ
Q: My English isn’t very good. Can I still read papers?
Yes. Start with Chinese-language integrative science communication and official position statements, and practice judging levels of evidence. When you do need to read the original text, PubMed abstracts usually have structured background, methods, results, and conclusions. Using translation tools to read the abstract can capture about 70% of the key points—you don’t need to grind through the full text word by word.
Q: A new study overturns what was previously believed. Which one should I trust?
Generally, trust “accumulated evidence” first. No matter how striking a single new study is, it’s only one piece of the puzzle. Wait until it has been replicated by other teams or incorporated into a new meta-analysis before considering adjusting your approach. Science approaches the truth gradually through replication and verification, not through the newest, flashiest headline.
Q: How small does the p-value actually need to be to count?
0.05 is just a conventional threshold, not a sacred number. Rather than obsessing over the p-value itself, I’d rather you develop the habit of looking at effect sizes and confidence intervals. A result that’s “just barely p = 0.049” isn’t much more magical than “p = 0.051.”
Q: So who should I listen to in my everyday training?
Listen to your own data, with quality evidence as the framework. Research gives you direction and ranges; your training log, power, heart rate, and perceived exertion tell you whether it works “for you.” Treat research as a map and your body’s feedback as a GPS—use both together.
Q: How can I quickly judge whether supplement research is credible?
Three steps: first, check whether it’s manufacturer-sponsored; second, check whether the sample resembles your population; third, look at effect size rather than just whether it’s “significant.” Only consider it after passing all three checks—this usually filters out most of the hype.
Q: Is a meta-analysis always the most trustworthy?
It sits at the top of the evidence hierarchy, but it’s not a get-out-of-jail-free card. There’s a saying: “garbage in, garbage out”—if the original studies it aggregates are poor quality themselves, and there’s publication bias (positive results are more likely to be published, while null results often get buried in a drawer), the conclusion will be skewed as well. When reading a meta-analysis, pay attention to whether the authors assessed the quality of the included studies and whether they discussed heterogeneity (how much the results varied across studies).
Q: I’m terrified of numbers and get a headache just looking at them. Do I really need to understand statistics?
No. This article has never asked you to calculate anything from start to finish. What you need to train is “interpretive habits,” not “computational ability.” Distinguishing levels of evidence, looking at absolute values, and checking funding sources—none of these require doing math, yet they can shield you from the vast majority of misinformation. Let the statistical details accumulate slowly over time.
Q: What about research from wearable device (watch, power meter) manufacturers?
Treat it the same way as supplements. First check whether it was done by the manufacturer itself, whether the sample resembles you, and how large the effect size is. With device research, pay extra attention to “whether the measurement itself is accurate”—if even the sensing has error, the conclusions that follow naturally need to be discounted. Research validated by independent third parties carries more credibility.
Conclusion
Let’s return to the athlete at the beginning who asked me whether to stock up on beetroot juice. After that day, he didn’t buy it immediately. Instead, he looked up the study himself—the sample was only about a dozen people, all well-trained young cyclists, the effect size was moderate, and he found that results from similar studies actually diverged quite a bit. He finally told me: “Coach, I’ve decided to get my sleep and nutrition dialed in first. I’ll deal with this later.”
At that moment, I was happier than if he’d broken a PR. Because what he learned wasn’t a specific training method, but a critical-reading ability that would stay with him for life. In this era where “research proves it” is everywhere, the ability to read for yourself, think for yourself, and maintain reasonable skepticism is the most powerful equipment of all.
May you, from today on, whenever you see a sensational headline, smile and first ask: “What level of evidence is this? How large is the effect size? Are there traps in between?”—and only then decide whether to believe it.
This article is educational content and does not replace individual diagnosis or treatment advice from physicians, physical therapists, or nutritionists. If any physical discomfort, illness, or medication adjustment is involved, please seek individualized evaluation from professional medical personnel.
References
- Hierarchy of evidence(Wikipedia):https://en.wikipedia.org/wiki/Hierarchy_of_evidence
- Levels of Evidence(UC Davis Library):https://guides.library.ucdavis.edu/systematic-reviews/levels-of-evidence
- Practical vs. Statistical Significance(Statistics By Jim):https://statisticsbyjim.com/hypothesis-testing/practical-statistical-significance/
Related Reading
- The Replication Crisis in Sports Science: One Study Can’t Decide Everything—How Coaches and Athletes Should Read the Literature
- Correlation Is Not Causation: A Coach’s Guide to Reading Sports Science Research—Stop Being Fooled by a Single Headline
- Beetroot Juice and Nitrate Supplementation: A Coach’s Guide to Dosage, Timing, and Side Effects
- The Evidence Pyramid for Sports Supplements: What Actually Works, What’s Just a Fad, and How to Read the Research
一個測試有沒有認真練車的方法😂 #公路車
10 個月前
西進武嶺 免費訓練分析服務 Intervals | 練不夠還是練過頭?你哪一種類型選手?AI模型告訴你! | 備戰神器 | 公路車 訓練 | CT Yeh
4 年前
2021 96聯賽 桃園市長盃 4K多視角實況 當天選手瓦數/推力比/均速/時間 即時數據分析 | 公路車 | CT Yeh
5 年前
一日北高/長距離團騎 常見問題補充篇 / 組團或跟團的眉角 / 壯車友容易被瘦車友慢性拉爆 / 原來屁股痛可能是這個原因...? / 風場配速法 / 公路車 / CT Yeh
2 年前
#公路車 #Vo2Max #最大攝氧量 測驗 體驗 | 心肺測試
6 年前
拍單車比賽能賺多少?一日Phomi攝影師實境測試| #公路車 | CT Yeh | 用科學分析賺錢!
3 年前
西進武嶺 8000名單車友數據分析 PART1 | 從新手到高手數量/瓦數/推力比/FTP推力比/功率計使用率 大解析 | 公路車 | CTYeh
5 年前
大家都在開箱的...單車用藍芽對講耳機真的有幫助嗎? SENA BiKom 20 長距離旅遊 & 海鷗繞圈賽 實際體驗心得 / 公路車 / CT Yeh
9 個月前