New Insights in Cycling Aerodynamics: Research Progress on CdA Values of Fork and Frame Tube Shapes
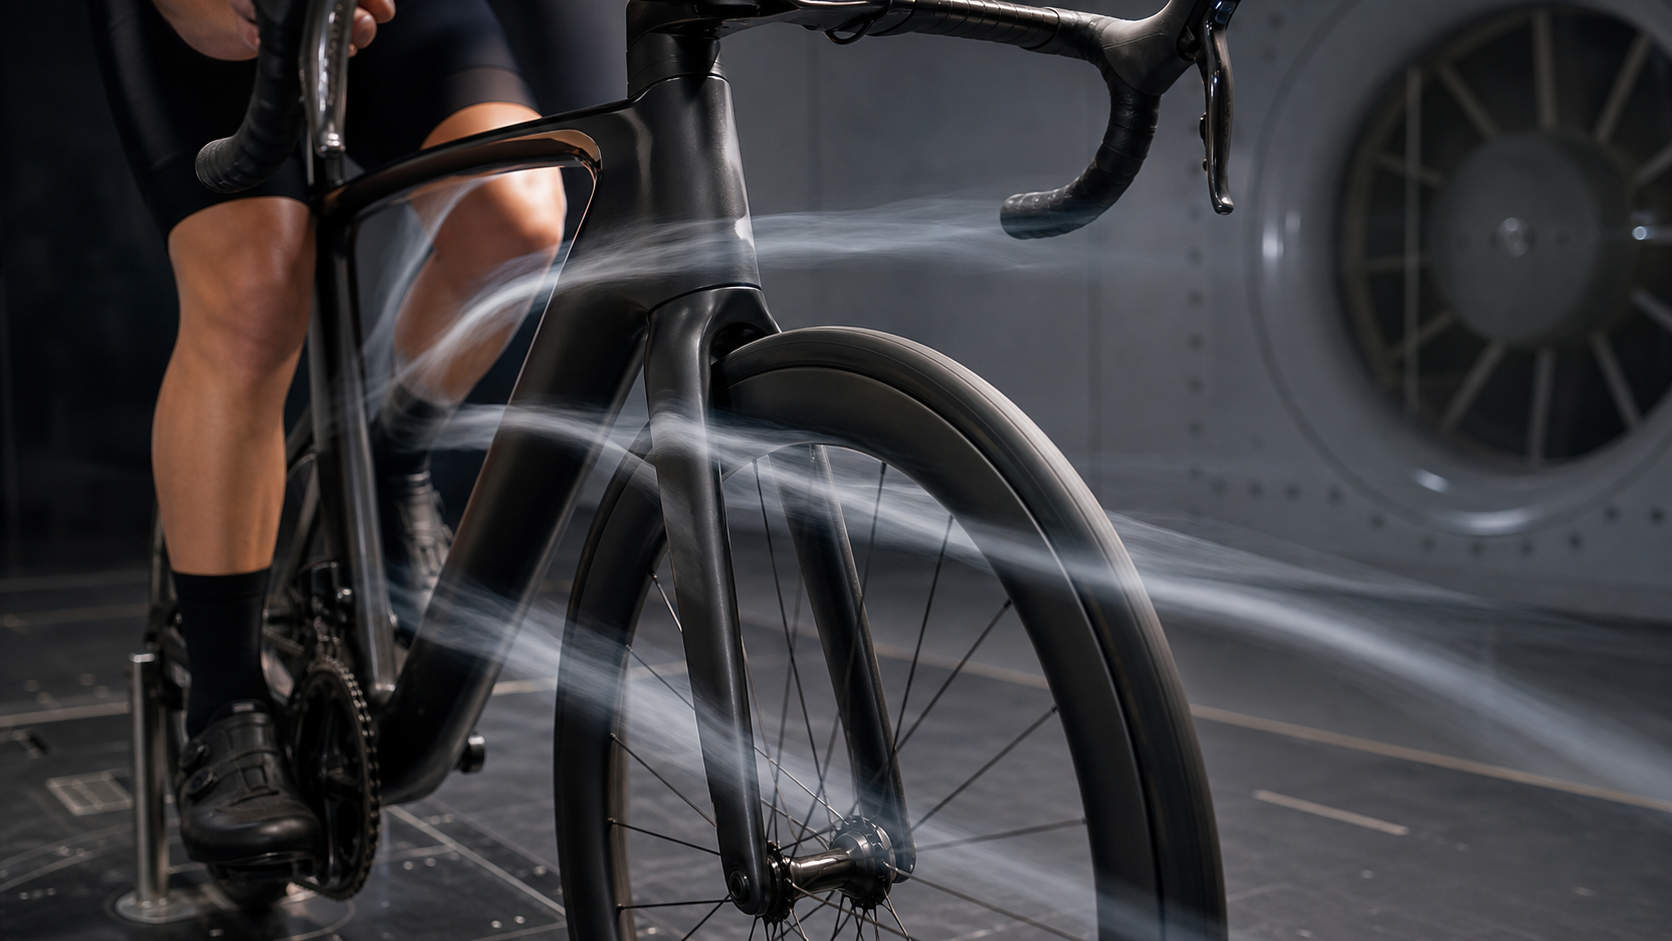
Introduction
When cruising on flat roads at 40 km/h, over 80% of the resistance a rider overcomes comes from aerodynamic drag. This figure explains why professional teams invest millions of dollars annually in aerodynamic research, and why “CdA (Coefficient of drag × Frontal area)” has become a core metric in modern racing bicycle design.
The lower the CdA value, the higher the speed achievable at the same power output, or the less energy consumed at the same speed. In recent years, computational fluid dynamics (CFD) simulation combined with traditional wind tunnel testing has brought aerodynamic optimization of forks and frame tube shapes to unprecedented precision.
The Physical Basis of CdA
Drag Equation
$$F_{drag} = \frac{1}{2} \rho v^2 \cdot CdA$$
where ρ is air density (approximately 1.225 kg/m³) and v is relative velocity. This equation shows that drag is proportional to the square of velocity—increasing speed from 40 to 45 km/h raises aerodynamic drag by approximately 27%, while the power required to overcome that drag increases by approximately 43%.
Rider System CdA Breakdown
| Source | Percentage of Total CdA |
|---|---|
| Rider body (torso + head) | 60–70% |
| Bicycle frame | 15–20% |
| Wheels (front and rear) | 8–12% |
| Handlebars and components | 5–8% |
From this breakdown, it is clear that rider position is the largest aerodynamic variable; however, assuming the same riding position, differences in frame and fork design can still produce a 5–10% CdA difference, equivalent to a time advantage of several tens of seconds in a time trial.
Research Progress in Fork Aerodynamic Design
Evolution of Airfoil Sections
Early aerodynamic forks applied NACA-series airfoils directly, but the yaw angle in real-world cycling is not fixed at zero—crosswinds, rider speed, and wind direction variations cause the actual yaw angle to typically fluctuate within 0–15°.
Modern fork designs therefore adopt the “Yaw Robustness” design principle:
- Truncated Airfoil / Kamm Tail: Compared to a full airfoil, truncating the trailing edge maintains a more stable low CdA across the 0–15° yaw angle range while reducing material usage
- D-tube Section: Some brands (such as Cervélo, Trek) adopt near-triangular sections that perform better than traditional airfoils at larger yaw angles
- Variable Thickness Ratio: The upper portion of the fork blades is thinner to reduce frontal drag, while the lower portion is thicker to enhance lateral stiffness
Fork–Frame Integrated Design
Between 2022 and 2024, several studies published in the Proceedings of the Institution of Mechanical Engineers investigated the “Junction Flow” issue at the interface between the fork and the frame’s head tube, noting that:
- When the fork is turned, the gap airflow between the fork blades and the tire is a long-underestimated source of drag
- While tight clearance designs can reduce CdA, they pose a clogging risk on muddy or gravel roads
- The latest design trend integrates a fairing into the fork crown, which can reduce CdA by approximately 0.003–0.005 m²
CFD Research on Frame Tube Shapes
Comparison of Major Tube Cross-Sections
| Tube Cross-Section | CdA Performance at Zero Yaw | Performance at 15° Yaw | Manufacturing Difficulty |
|---|---|---|---|
| Round | Baseline | Significantly higher | Low |
| NACA Airfoil | -12% | -8% | Medium |
| Kamm Tail | -10% | -14% | Medium |
| D-tube | -9% | -16% | High |
| Elliptical | -5% | -2% | Low |
Data source: Compiled from multiple CFD simulation studies, for relative comparison only
Tube Interference Effects
The complexity lies in the fact that each tube not only has its own drag but also affects the airflow over downstream tubes—this is known as the “tube interference effect.” Research has found:
- The wake from the down tube directly impacts the bottom bracket area, making it the most complex region for design
- Internal cable routing can reduce overall bike CdA by approximately 1–2%
- The widespread adoption of electronic shifting (Di2/eTap/AXS) has made the elimination of external cables possible, representing a significant source of CdA improvement in recent years
Practical Recommendations
For riders looking to improve aerodynamic performance, the following recommendations are ranked by cost-effectiveness:
- Prioritize improving riding position: Lowering the upper body height by 1 cm is estimated to reduce CdA by approximately 0.003–0.005 m², an effect far greater than changing the frame
- Choose an aero helmet: TT helmets can reduce CdA by approximately 0.010–0.015 m² compared to standard road helmets
- Consider aero wheels: Deep-section carbon wheels (50mm and above) show clear advantages at speeds >35 km/h
- Frame selection: Prioritize third-party wind tunnel test data (such as Tour Magazine, Bicycle Rolling Resistance) rather than blindly trusting brand-marketed CdA figures
Conclusion
Bicycle aerodynamic research is moving from pure wind tunnel testing toward an era integrating high-precision CFD simulation and personalized yaw angle analysis. Every gram of drag reduction in fork and frame design represents a precise integration of materials, geometry, and aerophysics. For competitive riders, understanding the composition of CdA is essential to making the most cost-effective equipment investment decisions.
Related Reading
- Advanced Bicycle Aerodynamics: How to Quantify and Improve Your CdA
- In-Depth Analysis of Bicycle Aerodynamics: The Science of Wind Tunnel Testing and CdA
- Aerodynamics and Cycling Speed: The Impact of CdA Values, Position Adjustments, and Equipment
- Interpreting Wind Tunnel Data: How Professional Teams Use Aerodynamic Data to Win Races
西進武嶺各路段 前8000名 大數據分析 配速攻略/功率/心律/推力比/維持率/踏頻/踏瓦比/牽車率 大公開 | 建大盃 NeverStop 可參考 | 公路車 | CT Yeh
5 年前
3D 列印車褲墊 / 舒適改善? / 無痕 x 分區壓縮 / ATK & Decider系列 / JE22黑科技 / #公路車 #CTYEH
11 個月前
西進武嶺 8000名單車友數據分析 PART1 | 從新手到高手數量/瓦數/推力比/FTP推力比/功率計使用率 大解析 | 公路車 | CTYeh
5 年前
Unaas X50 全碳纖幅條輪 數據實測對比PK | Lun Hyper 的高階版 | 板輪爬坡也可以很厲害? ! 武嶺2小時大師一起親測! CP值超高 | 公路車 | CT Yeh
4 年前
再一組! 全碳幅條 碟煞/無內胎輪組 開箱! 到底好騎嗎? UNAAS X40 | 公路車 | CT Yeh
4 年前
風櫃嘴時間 預測西進武嶺時間?13000名車友統計數據分析告訴你 !
5 年前
如果Pogačar騎西進武嶺可以多快?會破2嗎?各種情況深度推估探討 / 公路車 / CT Yeh
2 年前
公路車 BB培林大升級! / 備戰海鷗繞圈賽 Canyon Aerod & TIME 一起改 / MIT大廠 CEMA對鎖式陶瓷培林BB & 導輪 / 公路車 / CT Yeh
2 年前