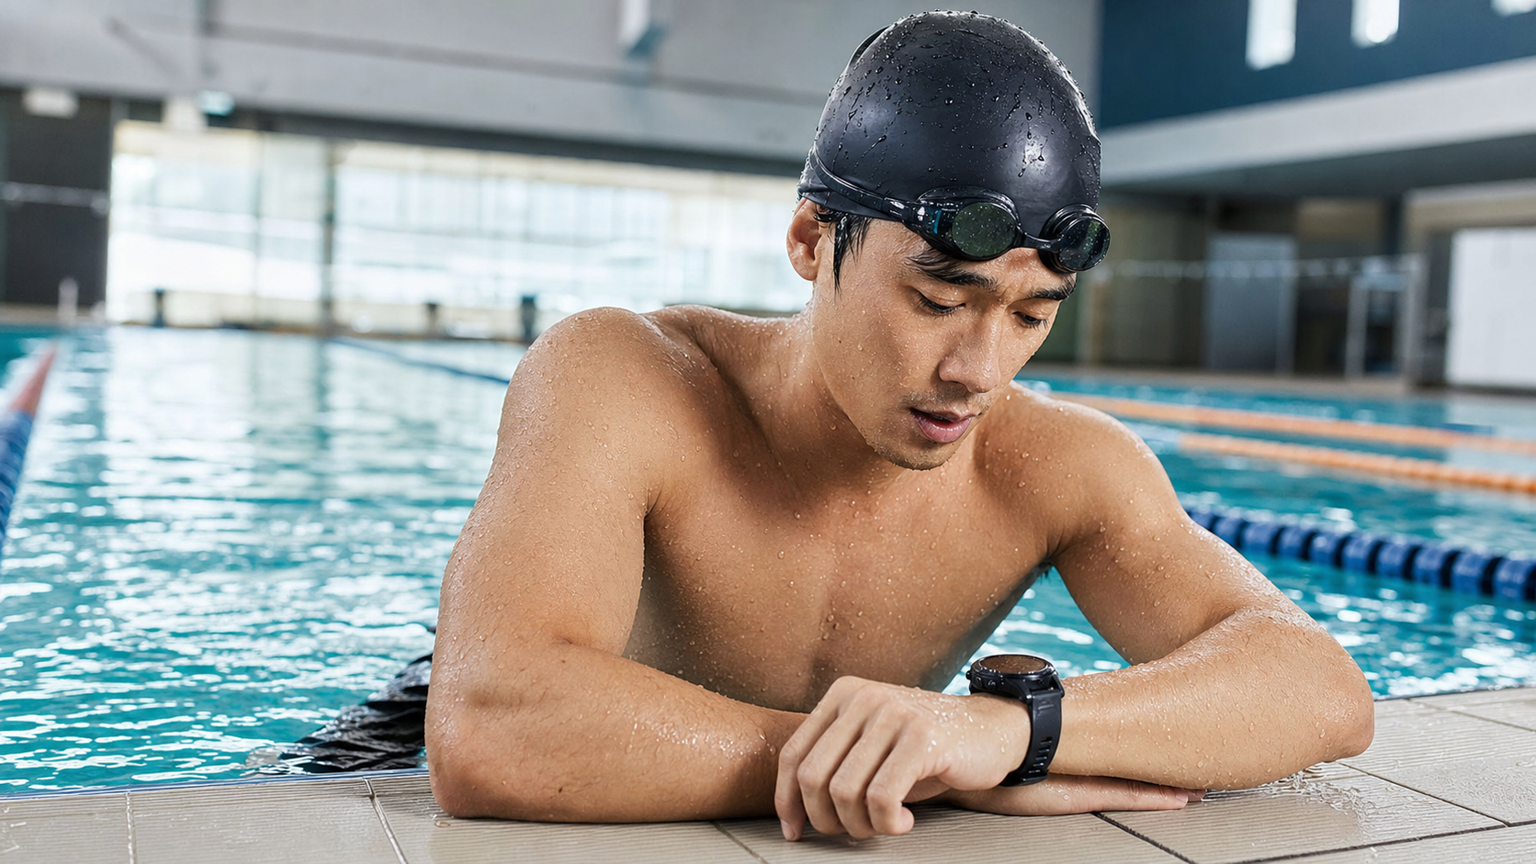
The Challenges and Opportunities of Swimming Data
Compared to cycling and running, swimming training has long lagged behind in data quantification—GPS doesn’t work underwater, heart rate sensors are disrupted by water flow, and pace fluctuates greatly with fatigue. However, with advances in waterproof smartwatches (Garmin, Apple Watch Ultra) and pool sensors, swimming data analysis has become a viable and valuable training tool.
This article introduces the three core metrics most commonly used by triathletes and competitive swimmers.
SWOLF (Swimming Efficiency Index)
SWOLF = strokes per length (usually 25 meters) + seconds to complete that length
Calculation example:
- 25 meters in 20 seconds, 18 strokes → SWOLF = 38
- 25 meters in 18 seconds, 22 strokes → SWOLF = 40
A lower number indicates higher efficiency (completing the same distance in less time and with fewer strokes).
SWOLF reference standards (25-meter pool, freestyle):
| Level | SWOLF Range | Description |
|---|---|---|
| Elite | 28–32 | Professional swimmer level |
| Advanced | 33–38 | Competitive triathlete |
| Intermediate | 39–44 | Amateur swimmer with basic training |
| Beginner | 45+ | Technique still needs significant improvement |
SWOLF’s greatest value lies not in the absolute number, but in trend changes—if your SWOLF consistently decreases under the same training intensity, it means your swimming technique is improving; if SWOLF rises with fatigue, it means your technique is breaking down under accumulated fatigue.
CSS (Critical Swim Speed)
CSS is the swimming equivalent of “FTP,” defined as the maximum sustainable pace you can hold for approximately 30–60 minutes, and serves as the baseline for calculating swimming training intensity.
CSS testing protocol:
- After warming up, swim 400 meters all-out and record the time as T400
- Rest for 10–15 minutes
- Swim 200 meters all-out and record the time as T200
- CSS (per 100 meters) = (T400 − T200) × 2
Calculation example:
- T400 = 6:40 (400 seconds), T200 = 2:55 (175 seconds)
- CSS = (400 − 175) × 2 / 100 = 4.5 seconds/meter = 1:30/100m
CSS allows you to set target paces for different training zones:
- Recovery swim: CSS + 20 seconds/100m
- Aerobic base: CSS + 10–15 seconds/100m
- Threshold training: Near CSS pace (±3 seconds/100m)
- Anaerobic intervals: 5+ seconds faster than CSS/100m
sTSS (Swimming Training Stress Score)
TrainingPeaks’ sTSS calculation logic is similar to rTSS, using CSS as the baseline and combining swim time with intensity:
sTSS = (swim seconds × pace ratio²) ÷ 3600 × 100
Where pace ratio = actual average pace ÷ CSS pace
Reference sTSS for typical swim workouts:
- 1500 meters easy aerobic swim: approximately 40–55 sTSS
- 3000 meters with threshold sets: approximately 80–100 sTSS
- Pre-race 1900-meter test for triathlon: approximately 60–75 sTSS
sRPE (Session Rating of Perceived Exertion) as a Supplement
When smart devices are unavailable, sRPE (Session RPE) is a simple alternative tool:
sRPE training load = session duration (minutes) × RPE (1–10 scale)
RPE scale reference:
- 1–2: Very easy, can talk comfortably
- 3–4: Easy, slightly noticeable
- 5–6: Moderate, requires focused breathing
- 7–8: Hard, difficult to talk
- 9–10: All-out sprint, unsustainable
A 60-minute session at RPE 7 → sRPE load = 420, comparable to other sessions.
Practical Recommendations
- Retest CSS every 4–6 weeks to track swimming speed improvements
- Record SWOLF for key sets in your training log to monitor efficiency trends
- During triathlon race preparation, weekly swim sTSS should not exceed 25% of total weekly TSS (otherwise swimming is overemphasized at the expense of cycling and running)
- Observe the magnitude of SWOLF increase during fatigued swimming (late in a session) to assess technical stability
Conclusion
Swimming is the most technique-dominant sport among the three triathlon disciplines. SWOLF reflects efficiency, CSS defines intensity, and sTSS quantifies load—together, these three form the data framework for swim training. When you begin examining every session through these numbers, your swim training will evolve from “just completing the distance” to “purposeful dual-track development of technique and fitness.”
Related Reading
- Swimming Efficiency Test: Strokes per 100 Meters and the SWOLF Metric
- Swimming Efficiency Metric SWOLF: Calculation Methods and Improvement Strategies
- A Complete Interpretation of the SWOLF Metric: Optimizing Swimming Technique with One Number
- Swim Training Logging Tools: An In-Depth Review of Data Analysis Features in Swimsense and Swim.com
西進武嶺 免費訓練分析服務 Intervals | 練不夠還是練過頭?你哪一種類型選手?AI模型告訴你! | 備戰神器 | 公路車 訓練 | CT Yeh
4 年前
西進武嶺 8000名單車友數據分析 PART1 | 從新手到高手數量/瓦數/推力比/FTP推力比/功率計使用率 大解析 | 公路車 | CTYeh
5 年前
武嶺配速表最佳使用方式 #bike
1 年前
2026 車錶排行榜!誰是最多車友正在使用?練家子最愛哪款?🏆 (2萬名車友數據) / 公路車 / CT Yeh
5 個月前
西進武嶺配速器 3.0更新 / NEW 免功率FTP估算! / 大數據xAI體能模型 / 如何模擬人止關前集團效應 / 配速儲存功能 / AI全台自行車賽事行事曆 / 公路車 / CT Yeh
1 年前
西進武嶺 自製新版AI配速表產生器 x 賽前攻略 抱佛腳! 沒有功率計也可以產生配速表嗎?有什麼其他眉角賽前要注意的呢? | 西進武嶺 / 東進武嶺 KOM 攻略 | 公路車 | CT Yeh
4 年前
Insta360/DJI做不到的!如何製作「騎士頭頂瓦數特效」單車影片?CycleDash 完整教學 / 超強批次影片數據疊加軟體
14 天前
免費UCI指定競賽騎乘軟體 Mywhoosh 概覽初體驗 / 畫質的天花板!? 用鈔能力做出來的 / 公路車 / CT Yeh
2 年前