Introduction
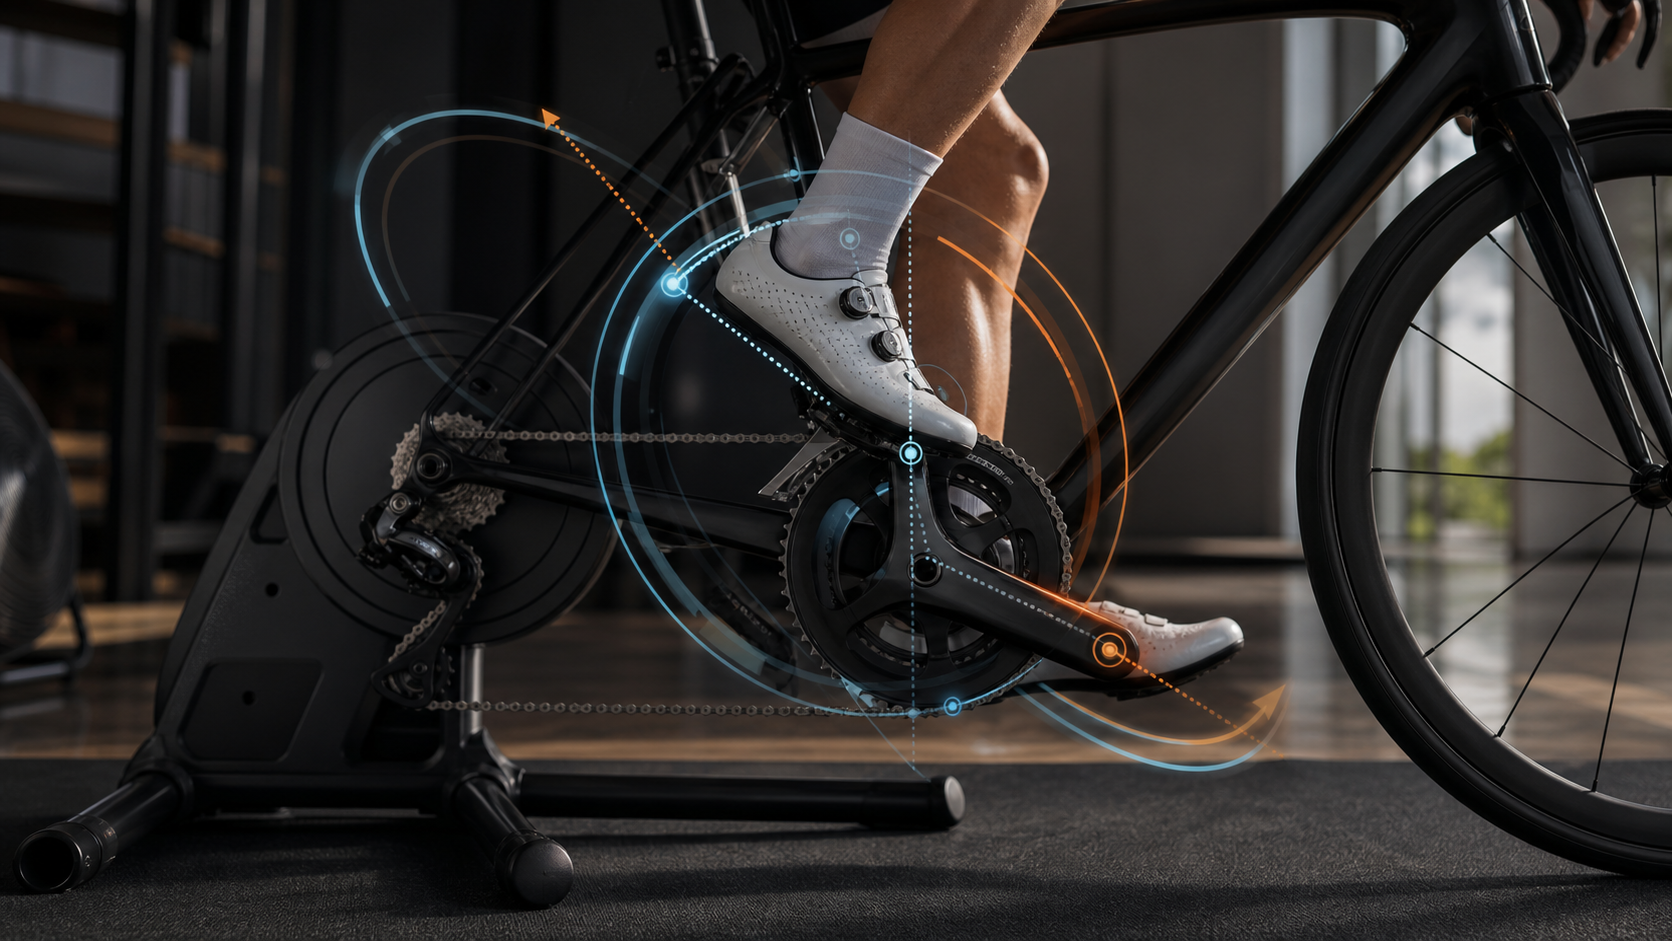
Your power meter shows 250W, but is that 250W a “high-quality” 250W or a “low-efficiency” 250W? As dual-sided pedal-based power meters like the Garmin Vector and Favero Assioma have become popular in the Taiwanese market, Cycling Dynamics has given riders the first opportunity to see the details of their pedaling technique through numbers. This article will break down the meaning of each metric and how to use this data to improve your training.
Analysis of Core Cycling Dynamics Metrics
1. Left/Right Balance
The most intuitive metric: the power output ratio between your left and right legs. The ideal value is 50/50, but most riders have a 3–5% asymmetry.
- Asymmetry exceeding 6% requires attention, and may stem from: compensation for old injuries, leg length discrepancies, or saddle position offset
- Important note: Chasing 50/50 isn’t necessarily correct—minor asymmetry caused by skeletal structure is a normal physiological phenomenon
2. Effective Pedaling Arc (EPA)
Indicates the range of crank angles (in degrees) over which effective force is applied during one pedaling cycle.
| EPA Value | Pedaling Technique Assessment | Possible Causes |
|---|---|---|
| <60° | Very poor | Only pushing down with the thighs |
| 60–90° | Needs improvement | Unskilled technique |
| 90–120° | Moderate | Average level |
| 120–150° | Good | Conscious pedaling technique |
| >150° | Excellent | Well-trained rider |
3. Torque Effectiveness (TE)
Represents the proportion of effective tangential force relative to total force applied (%). The calculation formula is based on a comparison between positive force (propulsion) and negative force (resistance):
- High TE (>85%): Most of the force applied is in the effective propulsive direction
- Low TE (<75%): There is noticeable “back-pedaling” or dead force
4. Pedaling Smoothness (PS)
Measures the evenness of power output—the ideal pedal stroke should deliver power as evenly as possible throughout the entire cycle, rather than surging only at the “peak force angle.”
- The higher the PS (closer to 100%), the smaller the power fluctuation, resembling the smooth output of an electric motor
- In practice, a PS of 60–75% is already a fairly good level
Interpreting Data in Different Scenarios
Climbing vs. Riding on Flat Roads:
When climbing, due to high torque demands and low cadence, a general drop in pedaling smoothness is normal. Seeing your PS drop from 70% on flat roads to 55% on the Wuling climb in Taiwan is nothing to panic about.
Metric Changes During Fatigue:
In the latter stages of long-distance rides, EPA and TE typically both decline. If you observe these metrics deteriorating rapidly during training, it may be a sign of energy depletion, and you should consider refueling or reducing intensity.
Technical Improvement Training Plan
Base Phase (2 sessions per week, 15 minutes each):
- Single-Leg Pedaling Drill: 10 minutes per session, aimed at improving EPA and developing a feel for passing through the dead spots
- High-Cadence Training (100–110 RPM): 10 minutes, focusing on smooth pedaling, with a target PS of >70%
Advanced Phase:
- Segment-Specific Target Setting: On the trainer, set a “target TE >85%” and perform 20 minutes of steady-state pedaling
- Real-World Validation: Climb on the Yangmingshan routes in northern Taiwan (e.g., from Ge Wai Farm to Zhuzihu) and observe how the metrics change with gradient
Practical Recommendations
- Record your average TE and PS for each training session to establish a personal baseline, then track trends on a weekly basis
- Don’t chase all metrics at once—it’s recommended to focus on improving just one metric per training cycle
- Cross-reference historical data in Garmin Connect or TrainingPeaks to more easily spot technical progress
- Note: Different power meter brands calculate Cycling Dynamics slightly differently, so avoid direct cross-device comparisons
- Technical training during the off-season rest period is more suitable for extensive drill practice than during the racing season
Conclusion
Cycling Dynamics has given pedaling technique a quantifiable language for the first time. No longer do you have to rely on feel and say “my pedaling feels rough”—you can now precisely state, “My effective pedaling arc is only 85 degrees, and I need to improve my technique through the top dead center.” Data-driven training is now standard equipment for the modern competitive rider.
Related Reading
- Road Bike Pedal Efficiency Analysis: How to Improve Your Pedaling Technique
- Quantifying Pedaling Smoothness: A Study of New Analytical Metrics for Power Meters
- Quantifying Cycling Efficiency (GE/PE): How to Become a More Economical Rider
- Pedaling Smoothness Training: Advanced Technical Workouts to Improve Pedaling Efficiency
全台首發!邁金P715踏板功率計!市場價格撼動者再出招 / 功率對比實測 / FAVERO ASSIOMA 可參考! / 公路車 / CT Yeh
1 年前
2025 自行車錶排行榜 兩萬車友大數據 / Garmin Bryton 排名會大洗牌嗎? / 全新的碼表前身分析 /公路車 / CT Yeh
1 年前
#公路車 #Fitting 靠人工智慧APP 幫你調整單車
6 年前
2026 車錶排行榜!誰是最多車友正在使用?練家子最愛哪款?🏆 (2萬名車友數據) / 公路車 / CT Yeh
5 個月前
單車胎壓觀察到的有趣現象,SRAM Quarq TyreWiz 2.0 無內胎胎壓計 / 裝了有哪些幫助? / Tubeless / 公路車 / CT Yeh
1 年前
Fitting訓練兩用功率車 ! Thinkrider ST900 完整實測!/ 坡度升降 / 鄰居測試/ smart bike/公路車/ CT Yeh
2 年前
如果Pogačar騎西進武嶺可以多快?會破2嗎?各種情況深度推估探討 / 公路車 / CT Yeh
2 年前
西進武嶺 8000名單車友數據分析 PART1 | 從新手到高手數量/瓦數/推力比/FTP推力比/功率計使用率 大解析 | 公路車 | CTYeh
5 年前