Introduction
“My FTP on the Wahoo KICKR is 260W, but last time I rode the Tacx Flow it was only 235W—how can there be such a big difference?” This confusion is quite common in Taiwan’s cycling community, especially when a team uses different trainer models internally, or when using a trainer at a hotel gym. Power readings from indoor trainers are not all “equal”—different trainer types have different measurement principles and accuracy levels, which can lead to systematic errors of 5–15%. Understanding these differences is what makes your training data meaningful.
Power Measurement Principles of the Two Main Trainer Types
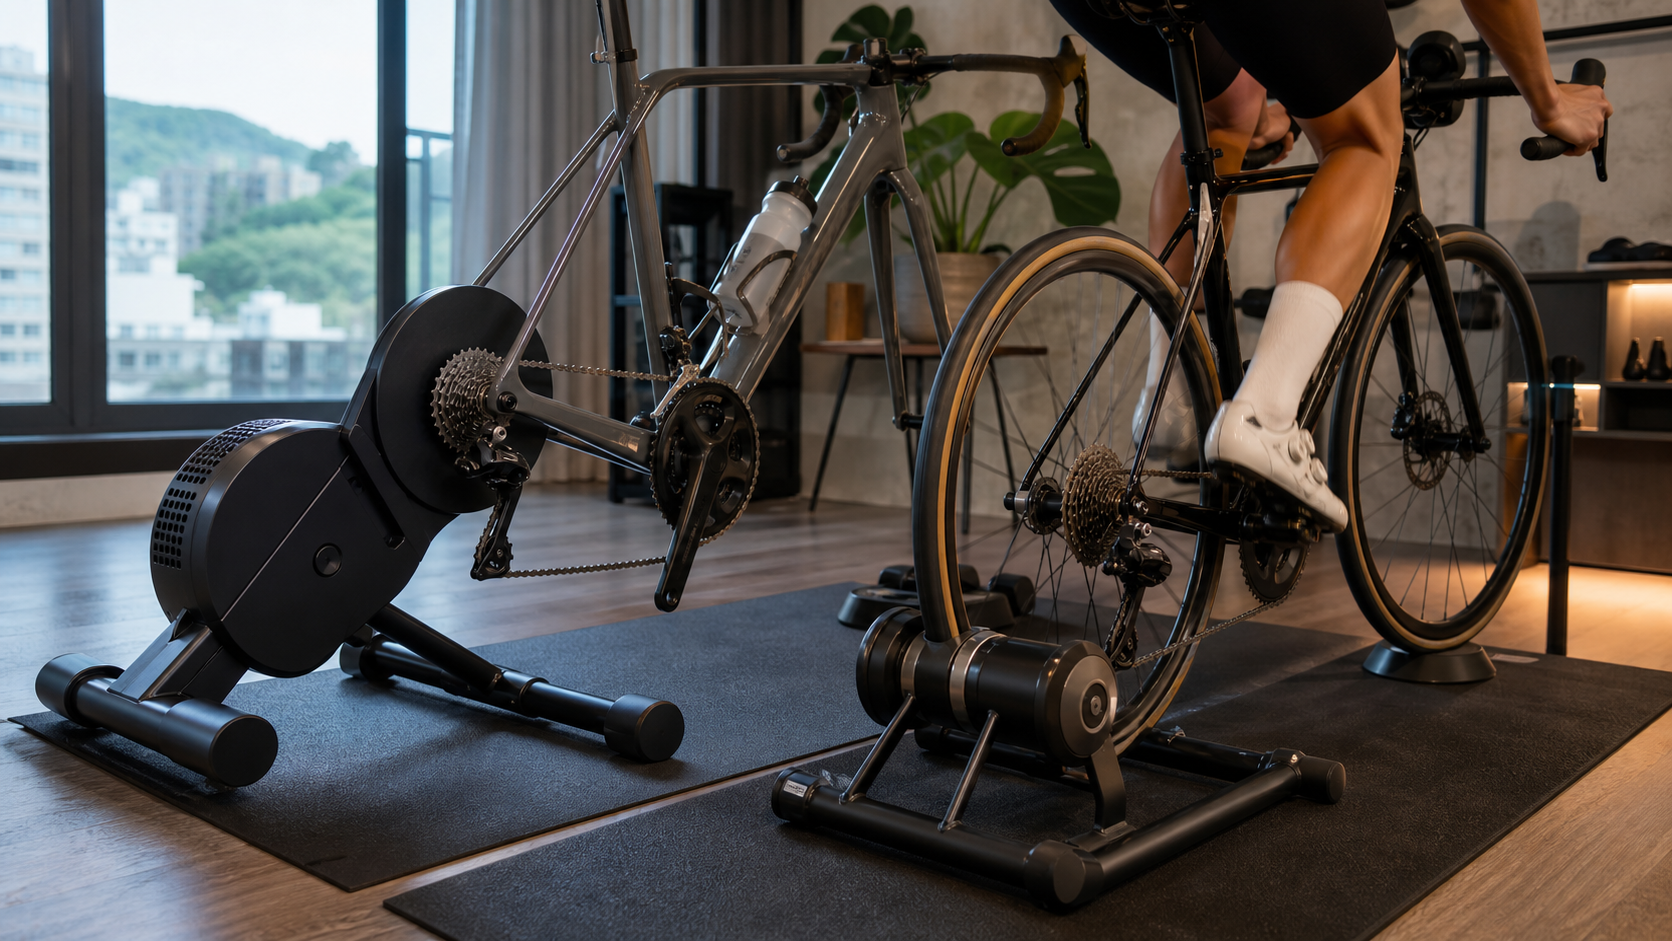
Direct Drive Trainer
Direct drive trainers require removing the rear wheel and connecting the hub at the derailleur end directly to the trainer body.
How power is measured:
- Uses a built-in strain gauge in the trainer body to directly measure torque
- Power = Torque × Angular velocity (P = T × ω)
- The measurement point is “at the end of the drivetrain,” close to the actual power output required at the rear wheel
Error characteristics:
- Manufacturer-specified accuracy is typically ±1–2%
- Unaffected by tire pressure or contact patch
- Precise control of magnetic or electromagnetic resistance makes ERG mode more accurate
- Main error sources: temperature drift in the trainer body (readings are low during the first 10 minutes of a cold start), insufficient calibration frequency
Representative products: Wahoo KICKR, Tacx NEO, Saris H3, Elite Direto
Wheel-On Trainer
Wheel-on trainers keep the rear wheel on the bike, with a “roller” pressing against the tire’s outer surface to provide resistance.
How power is measured:
- Some high-end wheel-on trainers have built-in power sensing, but most rely on algorithm-based estimation
- The algorithm calculates power based on wheel speed (velocity) combined with a known resistance curve
- Measurement accuracy is highly dependent on: tire model, tire pressure, and roller pressure settings
Error characteristics:
- Manufacturer-specified accuracy is typically ±5–10%
- Tire pressure 10 PSI low: power may be underestimated by 5–8%
- Inconsistent roller contact pressure: each setup variation makes power readings non-repeatable
- Rubber wear and tire brand affect the resistance curve
Representative products: Tacx Vortex Smart, Elite Tuo, Wahoo KICKR Snap
The Three Major Sources of Power Error
Error Source One: Different Measurement Points
| Measurement Point | Equipment | Losses Included | Typical Error |
|---|---|---|---|
| Crank (left/right) | Power meter crank | Chain/gear losses must be added separately | ±1–2% |
| Pedal | Power meter pedals | Same as above | ±1–2% |
| Hub | Power meter hub | Includes chain losses | ±1–2% |
| Direct drive trainer | Trainer body | Includes full drivetrain losses | ±1–2% |
| Wheel-on trainer (estimated) | Trainer body | Relies on algorithm | ±5–10% |
Key takeaway: Pedal power meters measure the power your feet deliver to the pedals, while direct drive trainers measure the power delivered to the rear wheel. Because the former includes drivetrain losses (approximately 2–4%), its readings are theoretically slightly higher. Therefore, the same rider showing 260W on pedal power meters may show 250–255W on a direct drive trainer—this is a normal physical difference.
Error Source Two: Temperature Drift
All strain gauges are affected by temperature. During a cold start on a direct drive trainer in winter, power readings may be 3–8% low for the first 10–15 minutes.
Solutions:
- Trainers like the Wahoo KICKR / Tacx NEO should undergo a “Spindown calibration” before starting a workout
- Allow the trainer to warm up for 10 minutes before beginning high-intensity training
- Perform a full Spindown calibration procedure every 2–4 weeks
Error Source Three: Power Smoothing in ERG Mode
Most direct drive trainers apply “smoothing” to power readings in ERG mode, displaying a 3-second or 10-second average rather than instantaneous power. This makes the numbers more stable, but it also masks momentary power fluctuations.
How to Ensure Consistency in Your Training Data
Strategy One: Establish a Personal “Trainer Correction Factor”
If you have both power meter pedals and a direct drive trainer, you can perform a “cross-comparison test”:
- Ride for 20 minutes at a steady Zone 4 on the direct drive trainer
- Simultaneously record per-minute data from both the pedal power meter and the trainer body
- Calculate the average difference ratio
- Derive your “personal correction factor” (e.g., trainer reads 3% lower than pedals)
Going forward, you can use this factor to convert readings when using different equipment.
Strategy Two: Always Test FTP on the Same Equipment
The most important principle: Set your FTP with whatever equipment you use, then do all training on that same equipment. Don’t test FTP on Trainer A, then train according to that FTP on Trainer B. Power readings from different trainers are not directly interchangeable.
Strategy Three: Standardize Every Wheel-On Trainer Setup
If you only have a wheel-on trainer:
- Inflate the tire to a fixed pressure before every session (write it down)
- Set the roller pressure using the same number of turns each time (not by feel)
- Use the same tire and do not mix different brands
“Conversion Guide” for Power Across Different Equipment
The following are general reference values (individual variation exists):
| Comparison Combination | Expected Difference | Explanation |
|---|---|---|
| Left-side power meter (×2) vs. dual-leg power meter | 0–8% difference | Pedaling asymmetry |
| Pedal power meter vs. direct drive trainer | Pedals 2–4% higher | Drivetrain losses |
| Direct drive trainer vs. wheel-on trainer | Direct drive 3–10% higher | Algorithm accuracy differences |
| Outdoor power meter vs. indoor direct drive trainer | Outdoor usually 2–5% higher | Heat dissipation differences |
Practical Advice
- Purchase priority: When budget is limited, the power data quality of a direct drive trainer far surpasses that of a wheel-on trainer, making it the top choice for training investment
- For riders using Zwift: Zwift’s speed calculation relies on power readings; insufficient power accuracy will make your Zwift speed slower, affecting race fairness
- Don’t panic if different trainers give different FTPs: You haven’t “gotten weaker”—it’s systematic error. Only FTP trends established on the same trainer are meaningful
- Pay attention to warm-up in Taiwan’s winter: During Taiwan’s winter (especially in mountainous areas), indoor trainers need a longer warm-up time; it’s recommended to warm up for 15 minutes before entering high intensity
Conclusion
The “absolute value” of power meter numbers is less important than the “relative trend.” As long as you consistently train and test on the same equipment, the data trend will reflect your true progress. Don’t be misled by numerical differences between different devices—what matters isn’t whether your FTP is 250W or 260W, but whether that number steadily climbs every 8–10 weeks. Choose a fixed measurement platform, then focus on making that number go up.
Related Reading
- In-Depth Bike Trainer Review: Full Comparison of Ride Feel, Noise, and Training Benefits—Direct Drive vs. Resistance
- Complete Bike Trainer Review: Wahoo KICKR vs Tacx NEO vs Garmin Tacx
- Trainer Buying Guide: Wheel-On, Direct Drive, and Smart Trainer Comparison
- Bike Trainers: Training Effects of Rollers, Smart Trainers, and Direct Drive Trainers
訓練台體驗) 2019台北自行車展 三大家 訓練台體驗 Tacx Neo Flux 2 Xepdo Apx Wahoo Kickr
7 年前
RAMP FTP Test 直播 究竟能撐到幾瓦 訓練台 Gravat Zwift
6 年前
ThinkRider 智騎 XXPRO 訓練台,高階機種功能 只要 1/3價格!? 實測功率對比、噪音實測 / 公路車 / CT Yeh
1 年前
Stages功率計 和 智騎 X7 Pro 訓練檯同時騎兩個 Rouvy 角色會一起進終點嗎?最後來點數據分析 | 公路車
5 年前
全台首發!邁金P715踏板功率計!市場價格撼動者再出招 / 功率對比實測 / FAVERO ASSIOMA 可參考! / 公路車 / CT Yeh
1 年前
Fitting訓練兩用功率車 ! Thinkrider ST900 完整實測!/ 坡度升降 / 鄰居測試/ smart bike/公路車/ CT Yeh
2 年前
西進武嶺 8000名單車友數據分析 PART1 | 從新手到高手數量/瓦數/推力比/FTP推力比/功率計使用率 大解析 | 公路車 | CTYeh
5 年前
一日北高前的西濱集訓 | 跟著11小時軍團 | 300W踩不動的大逆風 | 輪車破風差幾瓦?
6 年前