Home Aero Testing in Practice: Optimizing Your Riding Position Without a Wind Tunnel
文章導覽
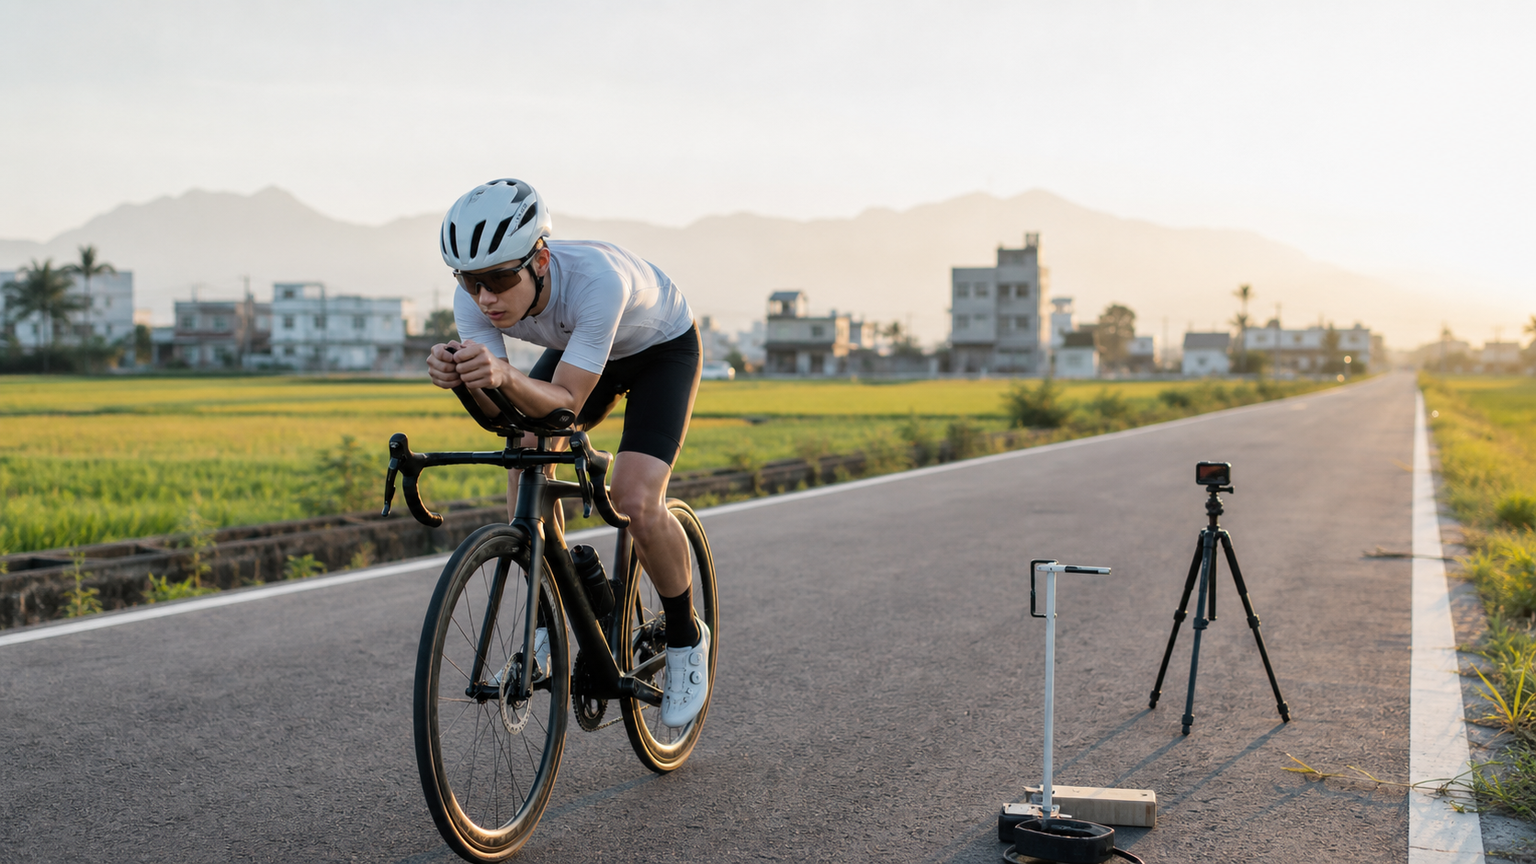
Home Aerodynamic Testing in Practice: Optimize Your Riding Position Without a Wind Tunnel
Aerodynamics is the biggest factor limiting cycling speed. Above 30 km/h, more than 70% of the power you produce goes toward overcoming wind resistance. Pro teams spend millions every year on wind tunnel testing, but for the average rider, some clever methods can yield significant aerodynamic gains without breaking the bank.
Aerodynamics Basics
CdA: The Only Number You Need to Know
CdA (Coefficient of Drag × Frontal Area) is a comprehensive metric for measuring aerodynamic drag:
- Cd (Drag Coefficient): A dimensionless coefficient determined by object shape
- A (Frontal Area): The area of the object facing the wind
The lower the CdA, the lower the drag. Typical CdA values for road cyclists:
- Casual position (on the hoods): 0.35-0.45 m²
- On the drops: 0.28-0.35 m²
- Time trial position: 0.20-0.28 m²
- Pro riders (extreme position): 0.18-0.22 m²
Speed impact: A 5% reduction in CdA is roughly equivalent to a 5% increase in power, which has a huge effect when cruising on flat roads.
Drag Formula
The formula for calculating aerodynamic drag force:
F_drag = 0.5 × ρ × CdA × v²
Where ρ is air density (approximately 1.225 kg/m³) and v is relative wind speed. Note that drag is proportional to the square of speed, so the faster you go, the greater the benefit of aerodynamic optimization.
Home Testing Methods
Method 1: Chung Method (Recommended)
The Chung Method, proposed by Dr. Robert Chung, is the most widely used outdoor CdA testing method, using power meter data to back-calculate CdA.
Principle:
Your power = aerodynamic drag power + rolling resistance power + gravitational power + acceleration power
By recording power and speed data under known conditions, the CdA value can be isolated.
Required equipment:
- Power meter (essential)
- Bike computer (recording speed, elevation, temperature)
- Computer software: Golden Cheetah (free) or Best Bike Split
Test procedure:
-
Choose a course: Find a flat, straight road with low traffic, at least 2-3 km long. Avoid windy days, or choose an out-and-back route to cancel out wind effects.
-
Control variables:
- Wear the same kit
- Same tire pressure
- Fixed power output (suggested 200-250W, or your Sweet Spot)
- Record temperature and wind direction
-
Execute the test:
- Ride 3-5 out-and-back runs at steady power
- Record complete power and speed data for each run
- Change only one variable at a time (e.g., elbow width, head position)
-
Data analysis:
- Import into Golden Cheetah’s Aerolab tool
- Adjust CdA and Crr (coefficient of rolling resistance) parameters
- Match the virtual elevation curve to the GPS elevation curve
- The CdA value at which they match is your measurement result
Accuracy: ±3-5% (requires good test conditions and multiple repetitions)
Method 2: Velodrome Testing
If you have access to an indoor velodrome, test accuracy can be greatly improved.
Advantages:
- No wind interference
- Perfectly flat (banking angle known)
- Consistent surface
- Stable temperature
Method:
- Ride a known number of laps at fixed power
- Record lap times
- Repeat after changing the test item
- Lap time differences directly reflect aerodynamic changes
Accuracy: ±1-2%
Method 3: Steady-State Descent Testing
This is the simplest but least accurate method:
- Find a long, uniform gentle descent
- Stop pedaling and coast freely
- Record the steady-state speed
- Change position and compare the steady-state speed difference
Suitable for: Quickly comparing relative differences between positions; not suitable for obtaining absolute CdA values
Method 4: MyWindsock + Best Bike Split
Use online tools combined with your ride data for analysis:
- MyWindsock: Import Strava activities and combine with local weather data to estimate CdA
- Best Bike Split: Input a route and target time to simulate optimal pacing strategy
The accuracy of these tools depends on wind data quality, but they are valuable for tracking long-term trends.
Common Aerodynamic Optimization Items
1. Riding Position (Biggest Improvement Potential)
| Optimization Item | Estimated Savings | Difficulty |
|---|---|---|
| Moving from hoods to drops | 15-20% | Low |
| Narrowing elbow width by 3-5cm | 3-5% | Medium |
| Lowering head position | 2-4% | Medium |
| Tucking knees closer together | 1-3% | High |
| Flat back position | 3-6% | Medium |
Most important advice: Optimize your basic riding position first. Many riders spend big money on aero wheels while overlooking that basic position improvements can deliver greater gains.
2. Clothing (Best Cost-Effectiveness)
- Form-fitting skinsuit: Saves 3-8% compared to loose jerseys
- Pocketless jersey: Reduces turbulent airflow at the back
- Long socks vs. short socks: Shoe covers or aero socks can save 1-2%
- Helmet: Aero helmets save 2-5% compared to standard ones
- Zipper fully closed: Seems minor but can actually save 1-2%
3. Equipment and Accessories
- Frame bag placement: Avoid placing items in high-pressure zones
- Bottle position: Down tube bottles have lower drag than seat tube bottles
- Cable routing: Externally routed cables add more drag than internal routing
- Minimalist setup: Remove unnecessary accessories (spare saddle bags, extra light mounts)
4. Wheels
Aero wheels are indeed effective, but they are typically the lowest value-for-money among all optimization items:
| Rim Depth | CdA Improvement (vs. shallow rims) | Crosswind Stability |
|---|---|---|
| 30mm | 1-2% | Excellent |
| 45mm | 3-5% | Good |
| 60mm | 5-8% | Fair |
| 80mm+ / Disc | 8-12% | Poor |
Real-World Test Case
Below are the actual test results from a Taiwanese cyclist (height 175cm / weight 68kg / FTP 260W):
Baseline: Standard riding position, regular jersey, 30mm rim depth wheels
- CdA = 0.332 m²
- Estimated 40km TT time: 62:30
Optimization steps and effects:
- Moving to drops + lowering head → CdA = 0.295 m² (saving 11.1%)
- Switching to a skinsuit → CdA = 0.282 m² (additional 4.4% saving)
- Upgrading to 50mm aero wheels → CdA = 0.271 m² (additional 3.9% saving)
- Adding an aero helmet → CdA = 0.262 m² (additional 3.3% saving)
Final result: Estimated 40km TT time dropped to 55:40, an improvement of nearly 7 minutes!
Common Misconceptions
- “I don’t ride fast, so aerodynamics don’t matter”: Even at a cruising speed of 25 km/h, wind resistance still accounts for over 50% of total drag
- “Equipment matters more than position”: Riding position improvements are usually greater than any equipment upgrade
- “Wind tunnel data can be applied directly”: Wind tunnel conditions differ from real-world riding, so outdoor validation remains important
- “Low CdA is everything”: Overly pursuing low drag can sacrifice comfort and power output
- “One test is enough”: Aerodynamic optimization is an ongoing process; body condition and equipment wear all affect results
Conclusion
While home aerodynamic testing is not as accurate as professional wind tunnels, it is sufficient to identify the biggest improvement opportunities. Remember the priority order for aero optimization: position > clothing > helmet > wheels > other accessories. Start with free position adjustments and gradually invest in high-value equipment—you’ll be surprised at the speed gains you can achieve without spending a fortune.